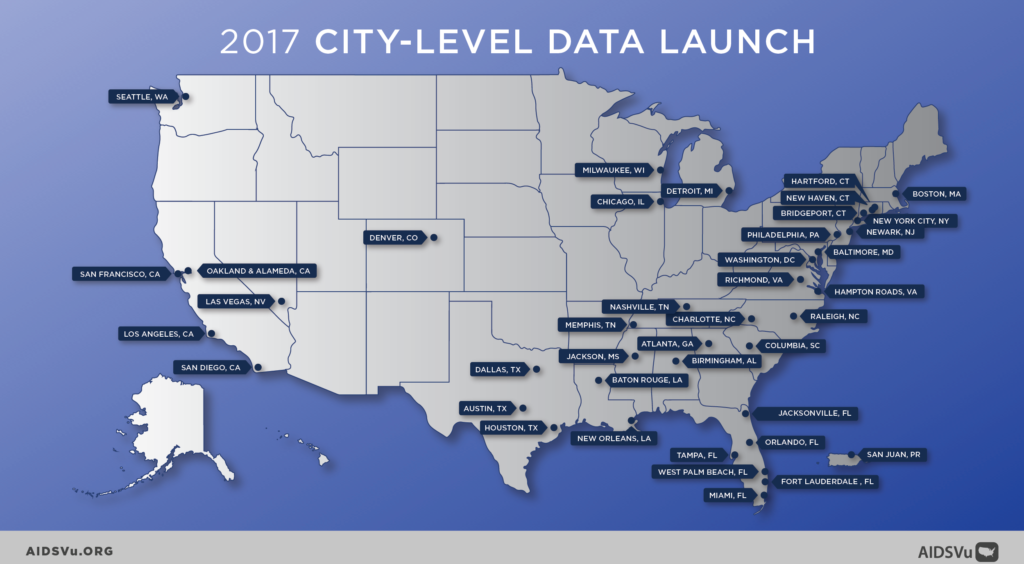
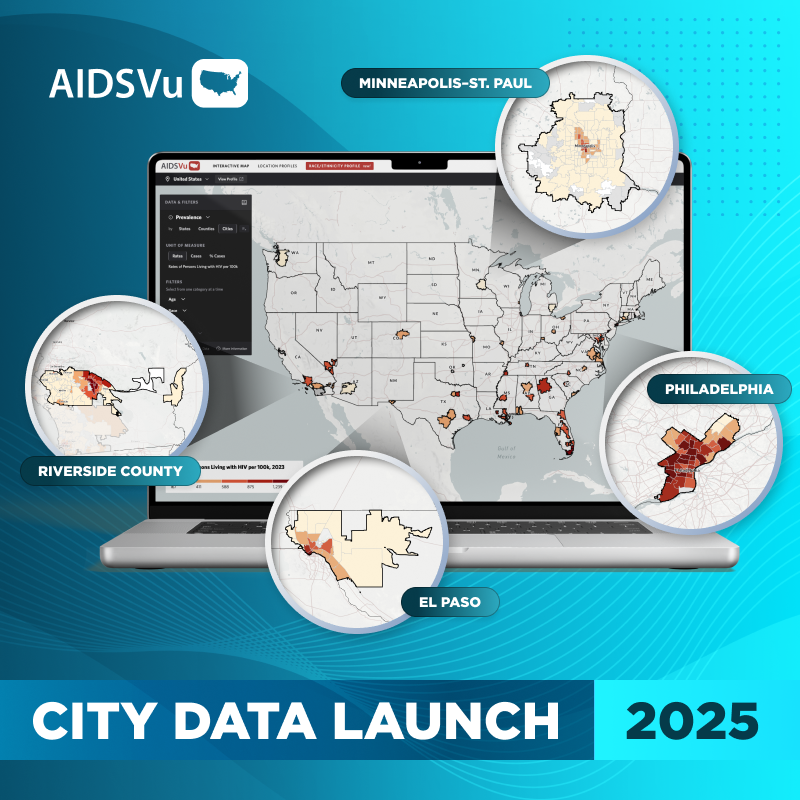
Today, AIDSVu released 2017 ZIP Code-level data and interactive maps for nearly 40 cities across the United States, illustrating how the HIV epidemic impacts cities and neighborhoods at a fine geographic level. Using the latest publicly available data at the city-level, these new maps visualize disparities in HIV prevalence and new infections, both geographically and across different demographic groups such as age, sex, and race. AIDSVu’s maps can be viewed alongside social determinants of health and overlaid with HIV testing, PrEP, and care service locations. View the maps here.
Visualizing HIV-related data helps people understand that where you live matters when it comes to being at risk for HIV. It also helps highlight where additional resources are needed to respond to areas within a city that may be underserved. Learn more about the HIV epidemic where you live and share AIDSVu resources in your outreach.

Major city-level data updates for 2019 include:
- ZIP code-level maps showing HIV prevalence (2017) and new diagnoses data (cumulative 2013 to 2017) for nearly 40 U.S. cities, including census tract, and community area data for three cities.
- Enhanced city data profile pages, including new diagnoses and HIV care continuum data, as well as data for the estimated number of transgender people living with diagnosed HIV (2017), for 36 U.S. cities that are easy to download and print.
- City-level HIV maps alongside maps of social determinants of health – such as poverty, high school education, median household income, income inequality, and people without health insurance.
- HIV prevention, testing, and Ryan White care services, as well as locations of housing opportunities for persons with AIDS and NIH-funded HIV prevention, vaccine, and treatment trial locations, all viewable on AIDSVu’s interactive maps.
Use these data to:
- Understand HIV where you live. Explore AIDSVu’s interactive city-level maps to visualize data on HIV, overlay HIV service locations, view social determinants of health, and print or share maps for your materials
- Tell your city’s story. View and utilize local statistics for your city or state for quick and printable fact sheets on HIV prevalence, new diagnoses, and more.
- Find where services are and are not. Search for HIV testing, PrEP, and care services in your city with the services locator.
- Conduct your own analysis. Download the ZIP Code-level data sets that inform AIDSVu’s visualizations for your own research and analysis.
About AIDSVu’s Annual Data Update
AIDSVu is a project of Emory University’s Rollins School of Public Health in partnership with Gilead Sciences, Inc. Now in its ninth year, AIDSVu continues to advance its mission to make HIV data widely available, easily accessible, and locally relevant to inform public health decision making. The site aims to provide researchers, policymakers, and community members with a more comprehensive understanding of the HIV epidemic at the local-, state-, and national- level.
ZIP Code, census tract, and community area data were provided by state and city health departments, depending on the entity responsible for HIV surveillance, and compiled by researchers at the Rollins School of Public Health. Learn more about AIDSVu’s data sources here.


