AIDSVu News & Updates
Stay up to date with new data releases, maps, educational resources, infographics, and Q&As to help you better understand the HIV epidemic.


Beyond the Map
Explore AIDSVu’s easy-to-use tools and resources to learn more about the HIV epidemic in the United States.
Featured
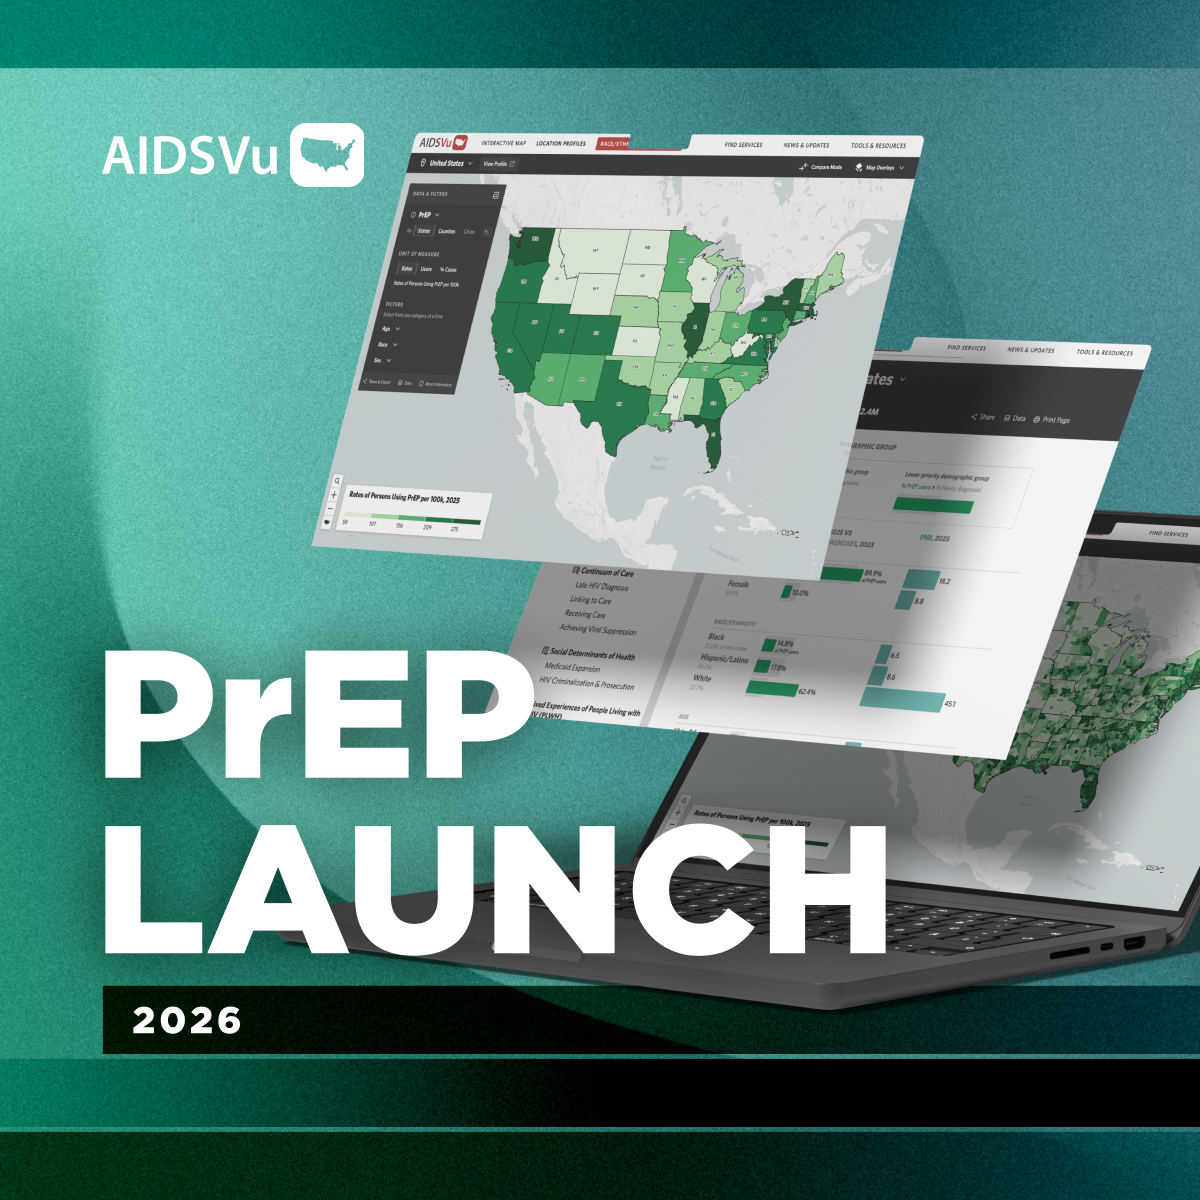
PrEPVu.org
PrEPVu is a platform from AIDSVu to understand PrEP use and equity in communities across the United States. Check it out today to learn about PrEP in the U.S.
Learn MoreHIV and the Faith Community
Learn MoreHealth Equity and HIV
Learn MoreEnding the HIV Epidemic
Learn MoreHIV in Black Communities
Learn More
Featured
Deeper Look: HIV Testing
An estimated 1.2 million people in the U.S. are living with HIV, and 1 in 7 people living with HIV are unaware of their status.
Learn MoreHIV in the South
Learn MoreHIV Among Hispanic/Latinx People
Learn MoreTransgender People and HIV
Learn MoreHIV Criminalization
Learn MoreView Local Data
View city, county, state, regional, and national profiles with local HIV/AIDS statistics, national comparison charts, and local resources.
Learn MoreLocate Services
Use the testing, Pre-Exposure Prophylaxis (PrEP), and other HIV services locators to find critical services near you.
Learn More