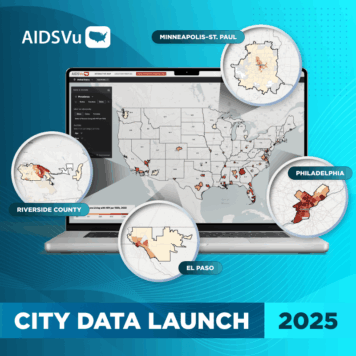
Today, on National HIV Testing Day, AIDSVu released new maps visualizing the HIV epidemic in 33 U.S. cities. AIDSVu’s principal researcher, Dr. Patrick Sullivan, took some time to discuss how AIDSVu maps are changing the way people see HIV.
Q: What makes this AIDSVu update unique from past data updates?
A: By adding maps for 11 new cities, AIDSVu now maps HIV for 33 cities that make up nearly 60 percent of the U.S. epidemic. These maps are highly detailed and allow users to drill down to the ZIP code level, which is an unprecedented look at how the disease is affecting our communities and where it is having the greatest impact.
For example, with new maps in cities like Jackson and Richmond, we can now look at HIV prevalence in 19 Southern cities. The South is heavily impacted by HIV, accounting for almost half of all new HIV diagnoses in the U.S., and these new maps illustrate that profound impact. At the ZIP code level, we see that prevalence rates for some parts of Baton Rouge and Jacksonville are just as high as ZIP codes in New York and Washington, DC, and as high as national HIV prevalence rates in many Central and West African countries. Those are sobering statistics, but it’s vital to know and understand the geography of the disease.
Q: Where do the data on AIDSVu come from?
A: AIDSVu is a public-private-academic partnership in its fifth year of providing the most detailed, publicly available view of HIV prevalence in the United States. High quality HIV surveillance data for the city maps are provided by the local health departments in 33 cities. The county level data come from the Centers for Disease Control and Prevention, and will be updated this fall.
The AIDSVu project was created by Emory University’s Rollins School of Public Health and Gilead Sciences, Inc., and we are fortunate to be guided by an Advisory Committee and a Technical Advisory Group, with representatives from federal agencies, state health departments and non-governmental organizations working in HIV prevention, care and research.
Q: Why did AIDSVu time the release to coincide with National HIV Testing Day?
A: In the fight against the HIV epidemic, we have made strides when it comes to raising awareness and removing stigma. But the fact remains that there are still an estimated 1.1 million people in the United States who have HIV. One in six Americans still does not know that they are HIV-positive – and the only way to know your status is through testing.
If we can show people what HIV really looks like where they live, I think that adds a real sense of urgency to why it’s important to be tested. The CDC recommends that everyone between the ages of 13 and 64 be tested for HIV routinely, and AIDSVu maps are drawing attention to the “why.”
Q: How do you hope to see AIDSVu being used?
A: AIDSVu is a powerful tool for a number of audiences. It is key for policymakers at all levels because it allows for better resource allocation by demonstrating where the needs for prevention, testing and treatment are most critical. We’ve seen examples of AIDSVu being used around the country in some really smart ways.
- In Alabama, a community-based organization used data from AIDSVu and other public data to determine where to place telemedicine centers to connect people living with HIV in rural areas to HIV specialists.
- In Philadelphia, Brown University scientists used maps of the most impacted neighborhoods to direct HIV testing providers to those city blocks most impacted by HIV, where the testers offered HIV testing door to door as part of a geo-informed testing campaign.
- In Denver, a community-based organization that provides support for women living with HIV used the AIDSVu maps to choose U.S. cities for educational seminars to reach the highest possible number of women.
AIDSVu is also a great way for health care providers and the general public to better understand how HIV impacts their communities. AIDSVu shows that nearly every area in the U.S. is affected, which underscores the importance of HIV testing. If you live in a darkly shaded area, there’s no need to be anxious – remember that HIV is not transmitted through casual contact. However, by knowing their HIV status as part of their overall health and well-being, everyone can protect themselves – even in heavily impacted parts of the country. Similarly, people who live in lightly shaded areas need to know that HIV has no geographic boundaries, so living in an area with a lower prevalence rate does not mean you are protected from HIV. If users don’t know where to get tested for HIV, the AIDSVu site offers testing and care services locators for people interested in taking action.
Q: What’s next for AIDSVu?
A: We are working on a new neighborhood mapping pilot, which will be released in the coming weeks, that details HIV at a level that aligns with how people identify their place in a community – by community area in Chicago and by ward in Washington, DC. This fall, we will be updating state- and county-level-data and it will be followed by the release of state and county level new diagnosis data, which gives people a national snapshot of the HIV epidemic and new infections.
AIDSVu will continue its mission of making HIV data widely available and locally relevant and hope to continue to be at the forefront of data visualization. You can sign up on to receive email notifications when new features or data are added to the site, and share your uses of AIDSVu with us at info@AIDSVu.org.


