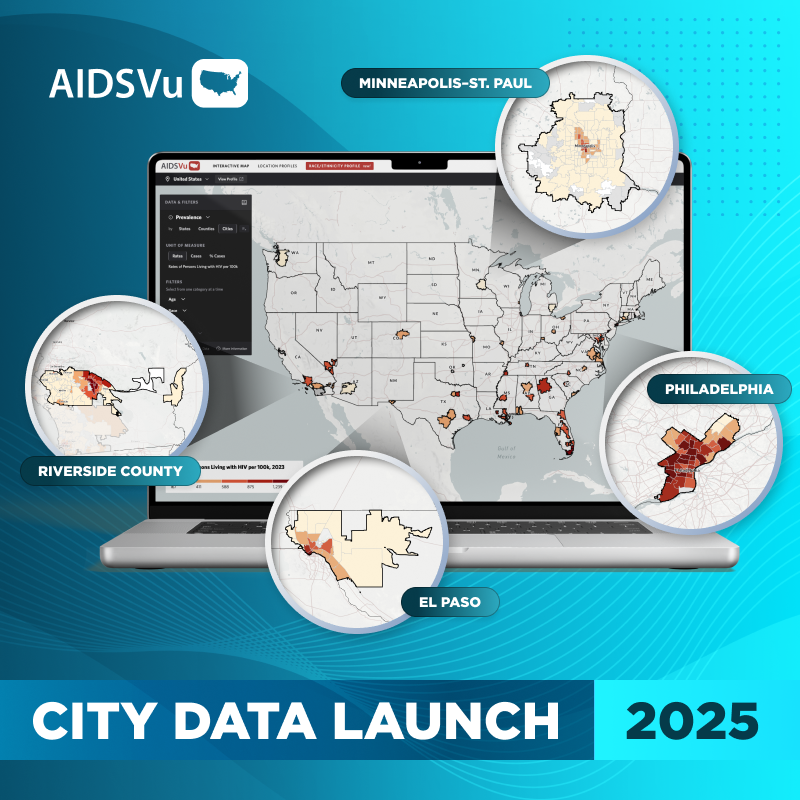
The AIDSVu website provides a wealth of data and resources that can help you learn and educate others about HIV in the United States. Our ready-made materials include a number of helpful downloadable resources such as national, state or local map views in Microsoft PowerPoint and PDF, as well as complete data sets that comprise the underlying sources for the maps and profile pages.
AIDSVu is pleased to announce the latest release of the 2012 data and maps illustrating the U.S. HIV epidemic across geographic levels that can assist with planning processes, resource allocation, presentations, grant writing and review. Additionally, for the first time, AIDSVu has released all historical data from 2009 to 2012 and slide decks from 2010 to 2012 to better understand the changes to the HIV epidemic locally and over time.
Notable features of the slide decks include:
- Slide sets that include a variety of map views showing the impact of HIV, as well as background information about AIDSVu and the data presented on the site.
- Data sets that contain the underlying data for the maps and local statistics pages.
You can download AIDSVu slide sets and use the wide variety of new map images to develop presentations or handouts that highlight the geography of HIV in the U.S. Additionally, local statistics pages offering profiles for 29 U.S. cities and all U.S. states provide easy-to-understand and printable snapshots of the epidemic to supplement your presentations.
For custom images, specific data questions, or to share you how use AIDSVu, reach out to us at info@aidsvuv32stg.wpengine.com.


