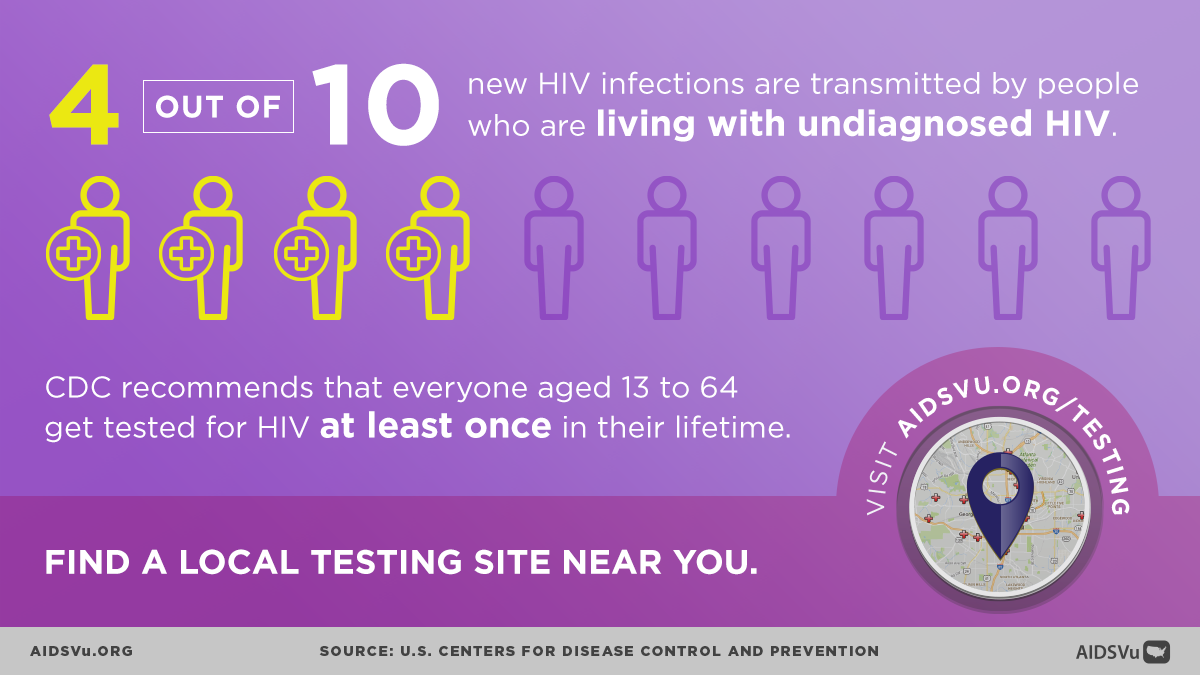
On June 27th, AIDSVu recognizes National HIV Testing Day (NHTD) as a day to encourage people to get tested for HIV, know their status, and get linked to treatment, care, and prevention services. Over 1.2 million people in the U.S. are living with HIV, and 13% of people living with HIV are estimated to be unaware of their status.
This year’s National HIV Testing Day theme is “HIV Testing is Self-care.” The importance of self-care has become particularly prominent during the COVID-19 pandemic, as the need for individual and community actions to protect and promote physical and mental health have been critical. HIV testing is an act of self-care, and knowledge of status is the gateway to engaging in prevention or treatment services that enable individuals, regardless of their status, to live a long and healthy life.
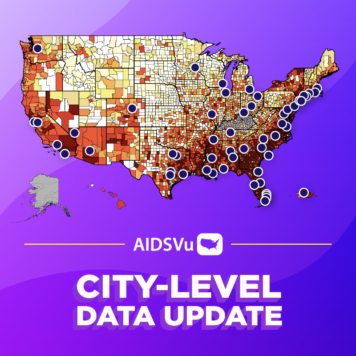
National HIV Testing Day also marks the annual update of AIDSVu’s 2020 ZIP Code-level HIV data and interactive maps for 43 cities across the U.S., illustrating how the HIV epidemic impacts cities and neighborhoods at a fine geographic level.
Using the latest publicly available data, these new AIDSVu maps visualize disparities in HIV prevalence, new HIV diagnoses, and along steps of the HIV care continuum at the ZIP Code-level and across different demographic groups such as age, sex, and race/ethnicity. Data on the HIV care continuum include linkage to care, receipt of care, and viral suppression. AIDSVu’s maps can be viewed alongside social determinants of health and overlaid with HIV testing, PrEP, and care service locations. View the maps here.
Note: Due to the interruptions of the COVID-19 pandemic, data trends for HIV prevalence, mortality and diagnoses are unavailable for the year of 2020. Although many health providers attempted to reinstitute their own HIV testing infrastructure during the pandemic via virtual and self-testing options, it is unlikely that HIV related data is accurate for this time period and is thus omitted.
Major city-level data updates this year include:
- ZIP Code-level maps showing HIV prevalence (2020) and new diagnoses (cumulative 2016 to 2020) for 43 U.S. cities.
- This includes a city entirely new to AIDSVu: Jersey City, NJ
- Updated cities in this release include:
- Atlanta, Austin, Baton Rouge, Birmingham, Bridgeport, Charleston, Charlotte, Chicago, Columbia, Dallas, Denver, Detroit, Fort Lauderdale, Fort Worth, Hampton Roads, Hartford, Houston, Jacksonville, Jersey City, Las Vegas, Memphis, Miami Dade County, Milwaukee, Minneapolis, Mobile, Montgomery, Nashville, New Haven, New Orleans, New York, Newark, Orlando, Philadelphia, Phoenix, Providence, Raleigh, Richmond, San Antonio, San Francisco, San Juan, Seattle, Tampa, and West Palm Beach
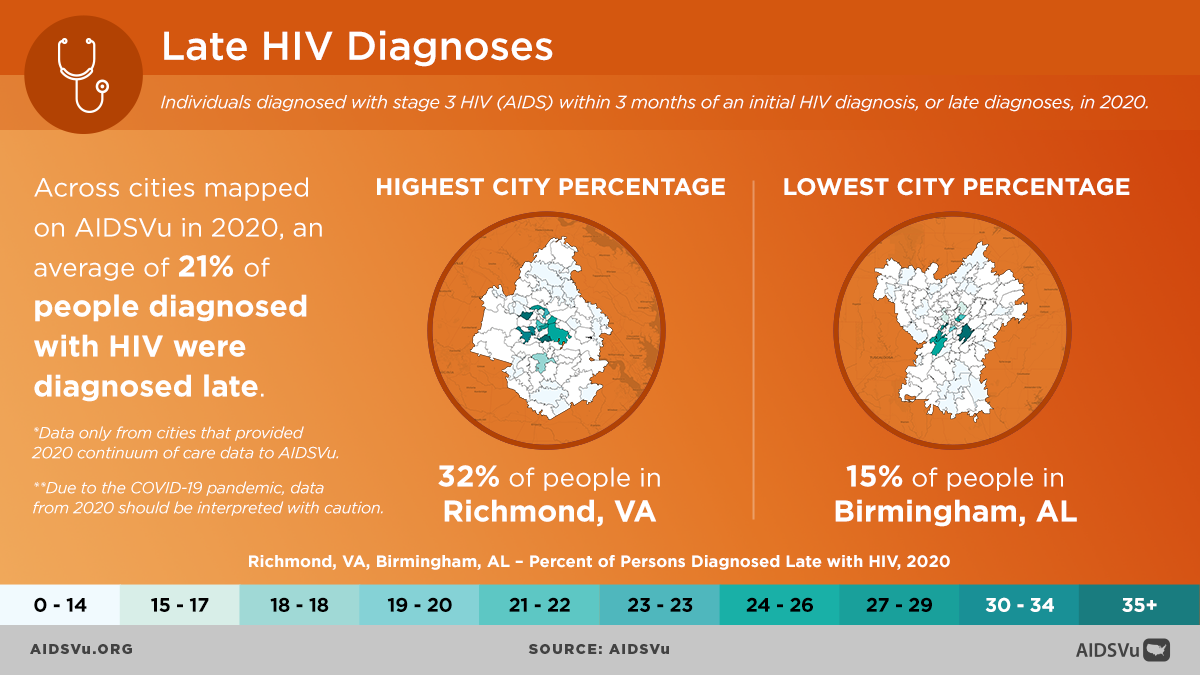
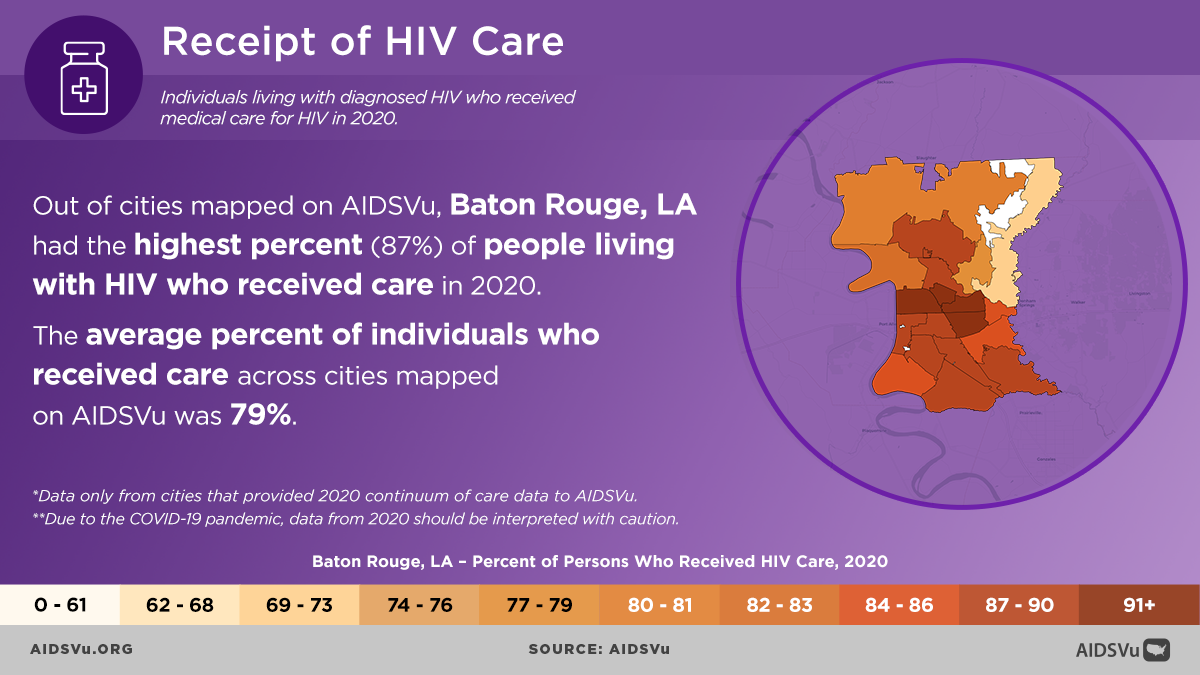
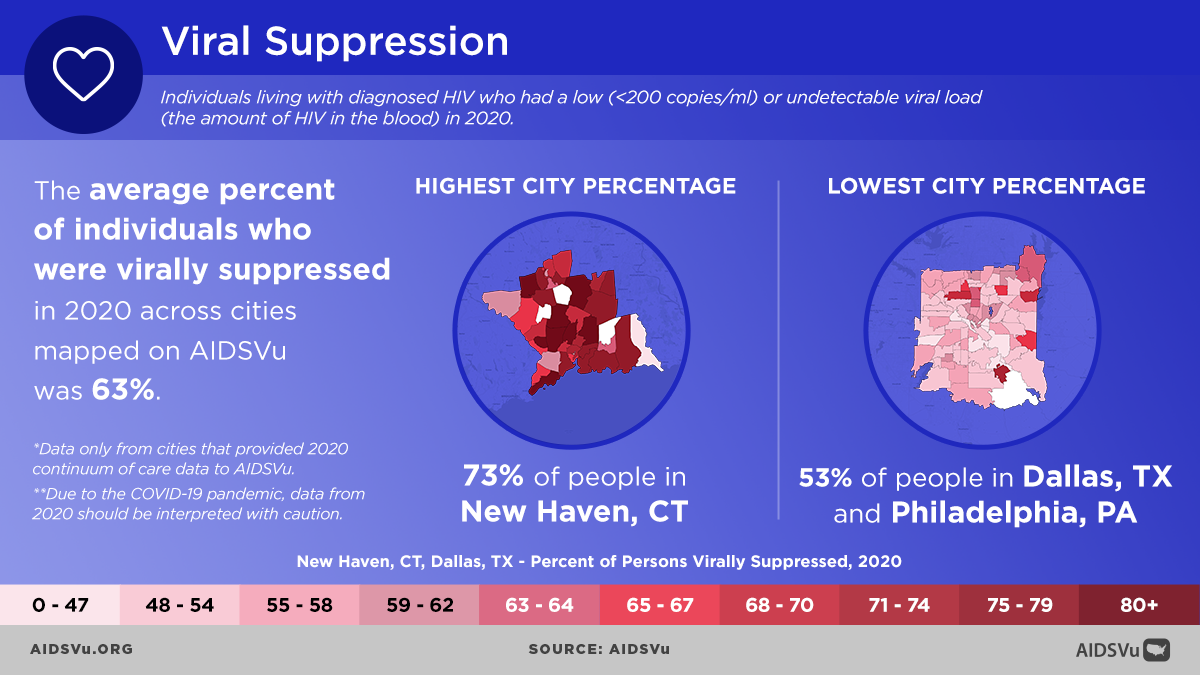
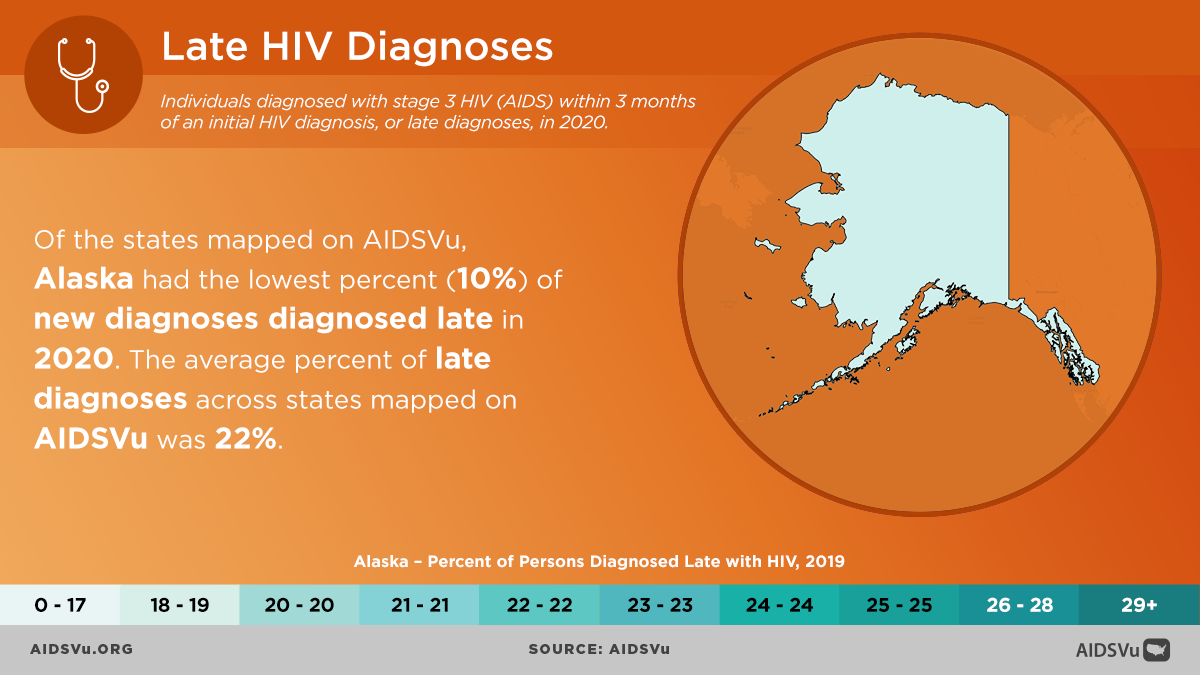
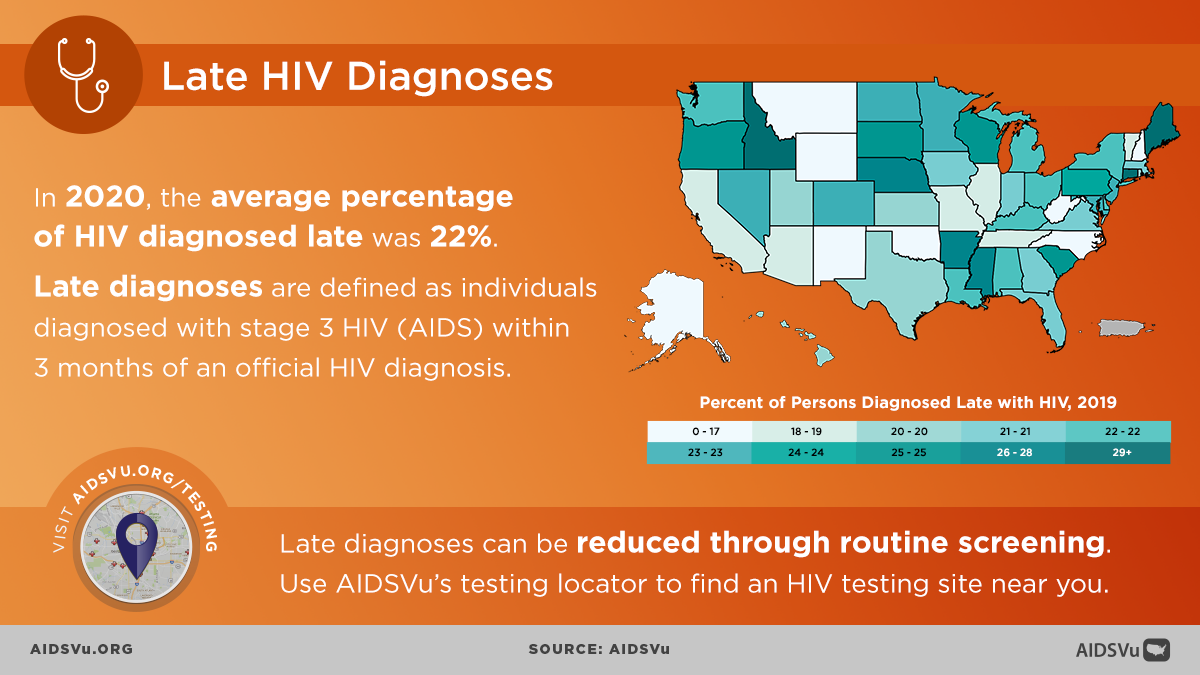
- ZIP Code-level maps showing HIV care continuum indicators such as late HIV diagnoses (cumulative 2016 to 2020), linkage to HIV care (cumulative 2016 to 2020), receipt of HIV care (2020), and viral HIV suppression (2020) for 42 U.S. cities.
- Enhanced city-data profile pages, including new diagnoses and HIV care continuum data, as well as the percent of people living with HIV by age (2020), for 43 U.S. cities.
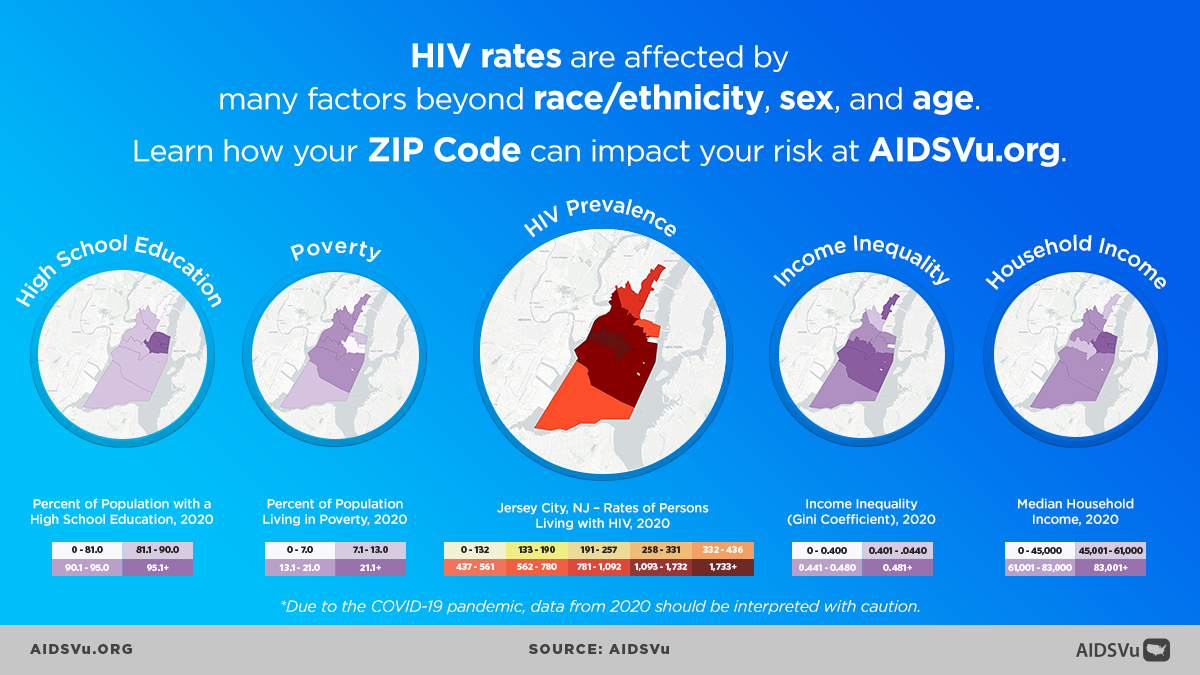
- ZIP Code-level HIV maps alongside maps of social determinants of health – such as poverty, unstable housing, high school education, median household income, and income inequality.
- Downloadable datasets are available for all data on AIDSVu in the Tools & Resources section, under datasets. They can be used by researchers to conduct their own analyses using AIDSVu data.
- Enhanced service locators available on interactive maps, including HIV prevention, testing, Ryan White care services, housing opportunities for people living with AIDS, NIH-funded HIV prevention, vaccine, and treatment trial locations.
City Spotlight: Jersey City, NJ
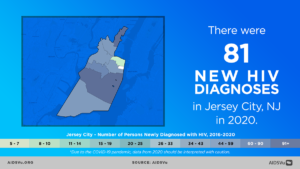
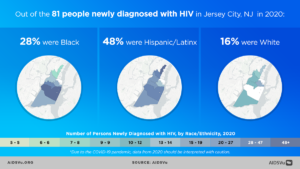
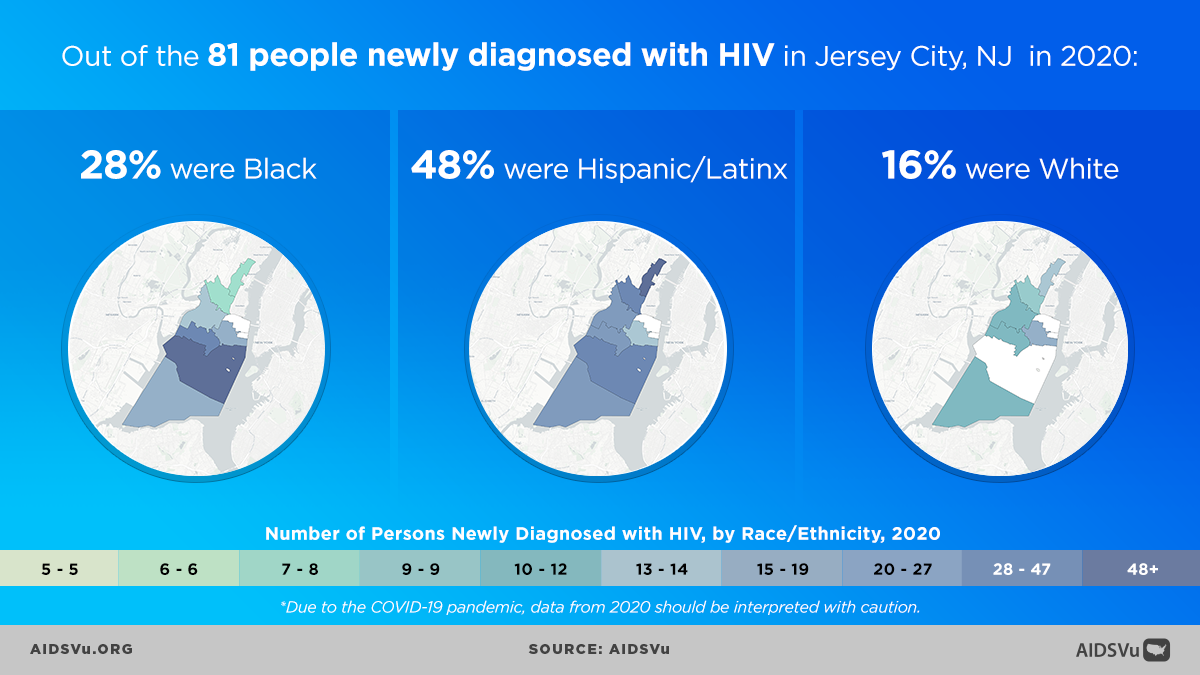
Jersey City, NJ, the newest city to have maps and a profile on AIDSVu, had 3638 people living with HIV in 2020. AIDSVu’s Zip-Code level maps can also visualize prevalence and new diagnoses in granular detail, as well as stratify this data by race/ethnicity, sex, age, and beyond.
HIV’s impact on a community is affected by many factors including poverty, income inequality, and other factors. AIDSVu’s social determinants of health maps show the impact of these factors on the residents of Jersey City on a fine geographic level.

To learn more about HIV in Jersey City, see its city profile.
Share our Infographics


Use these data to:
- Understand HIV where you live. Explore AIDSVu’s interactive ZIP Code-level maps to visualize HIV data, overlay HIV service locations, view social determinants of health, and print or share maps for your materials.
- Tell your city’s story. View and utilize local data for your city or state for quick and printable fact sheets on HIV prevalence, new diagnoses, and more.
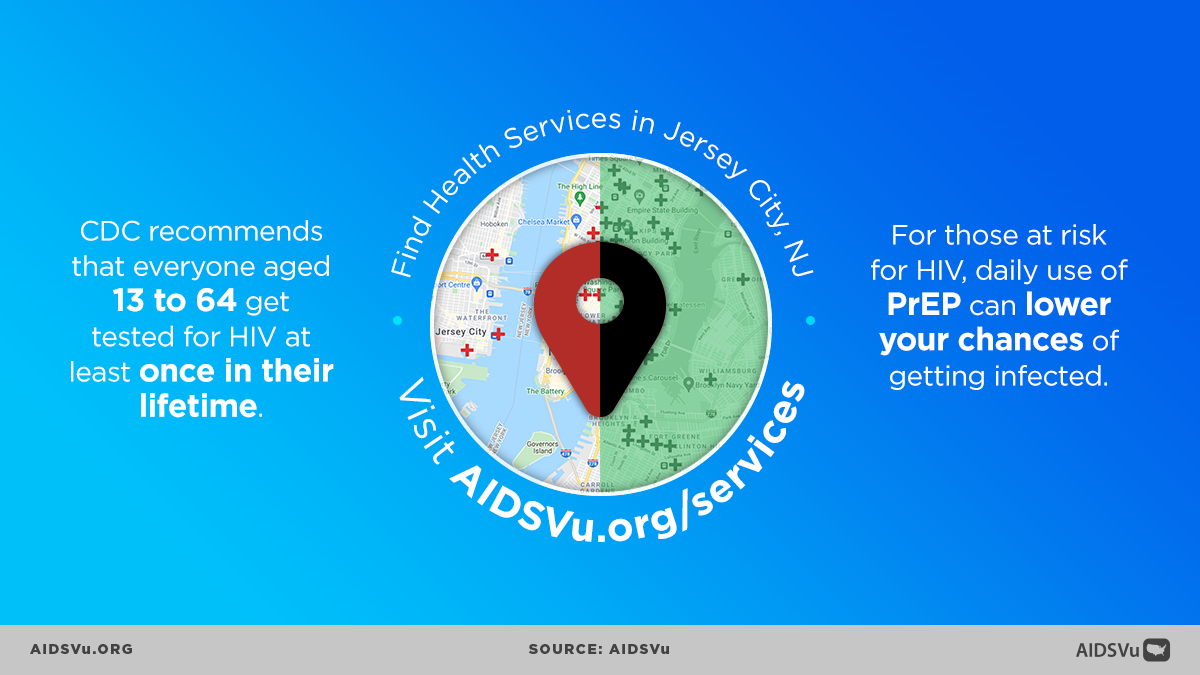
- Find where services are and are not. Search for HIV testing, PrEP, and other HIV services near you with AIDSVu’s service locator.
- Conduct your own analysis. Download the city-level datasets that inform AIDSVu’s visualizations for your own research and analysis.