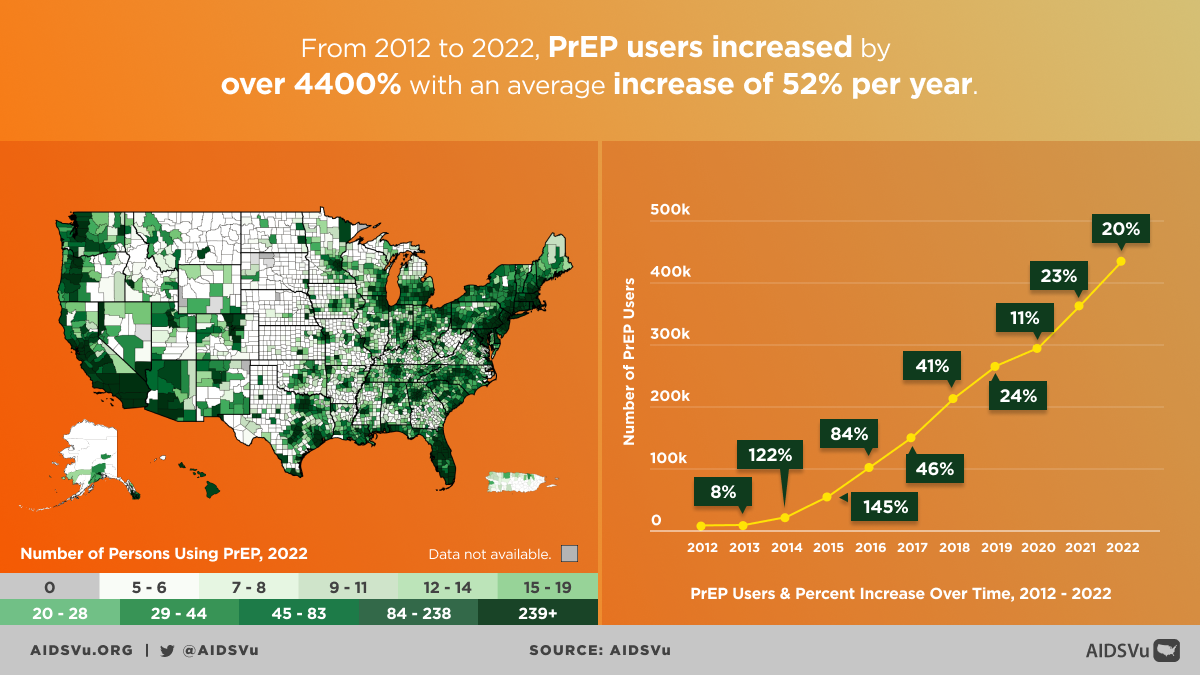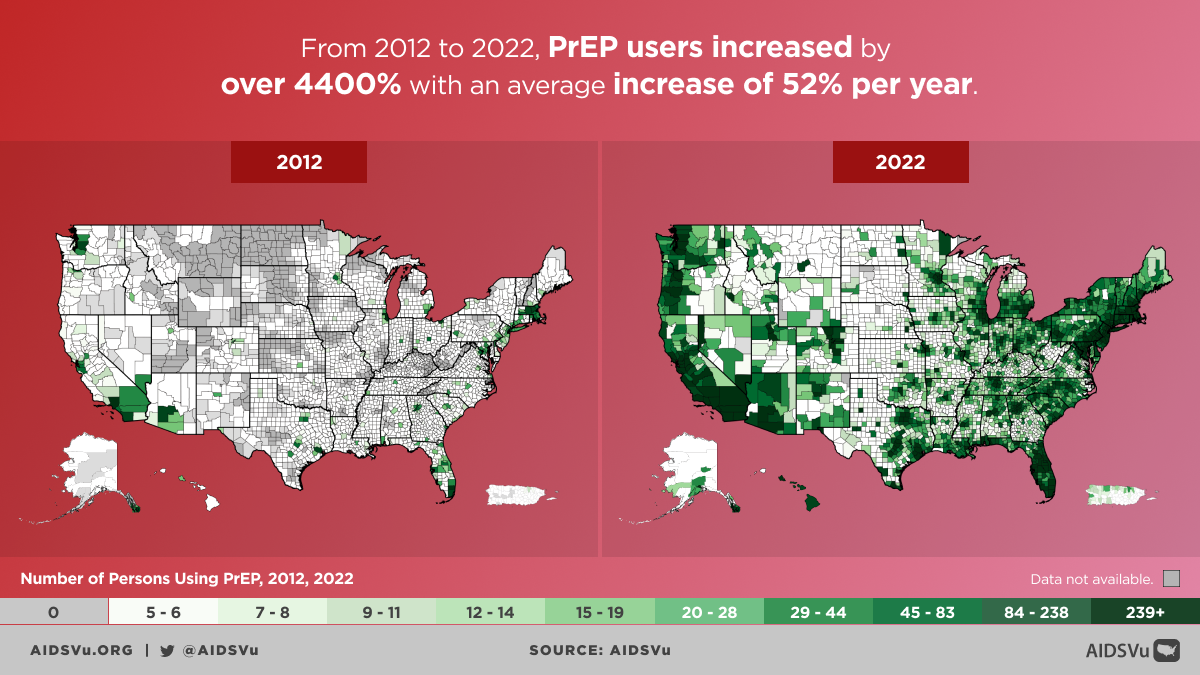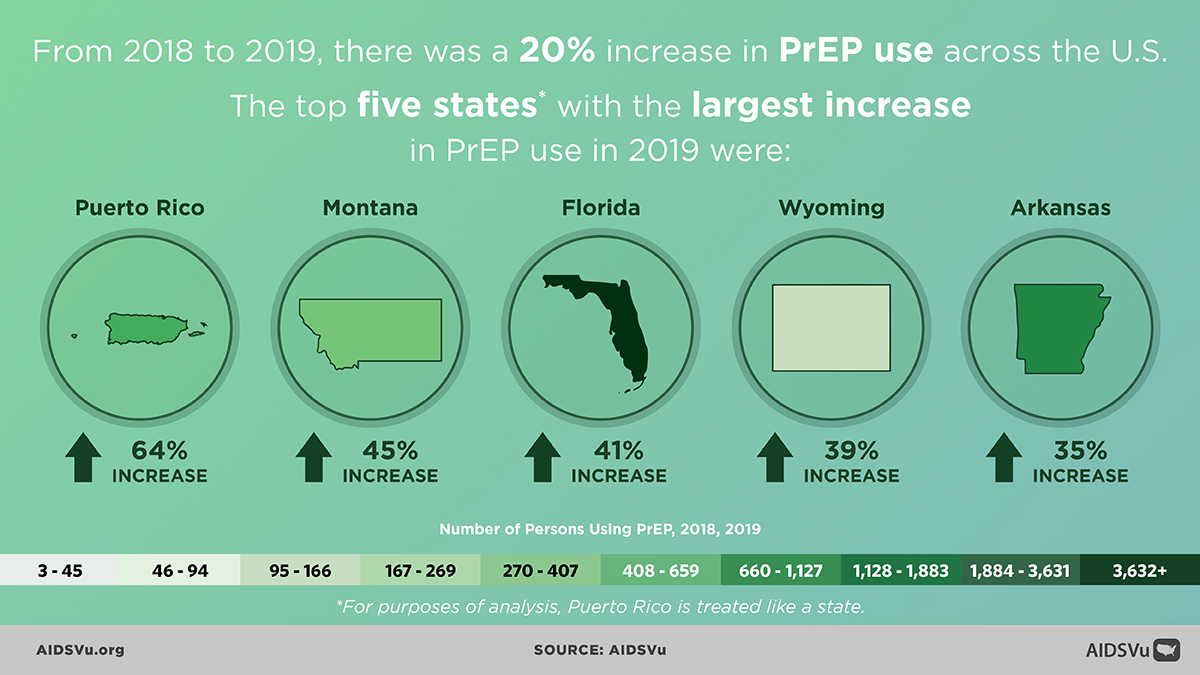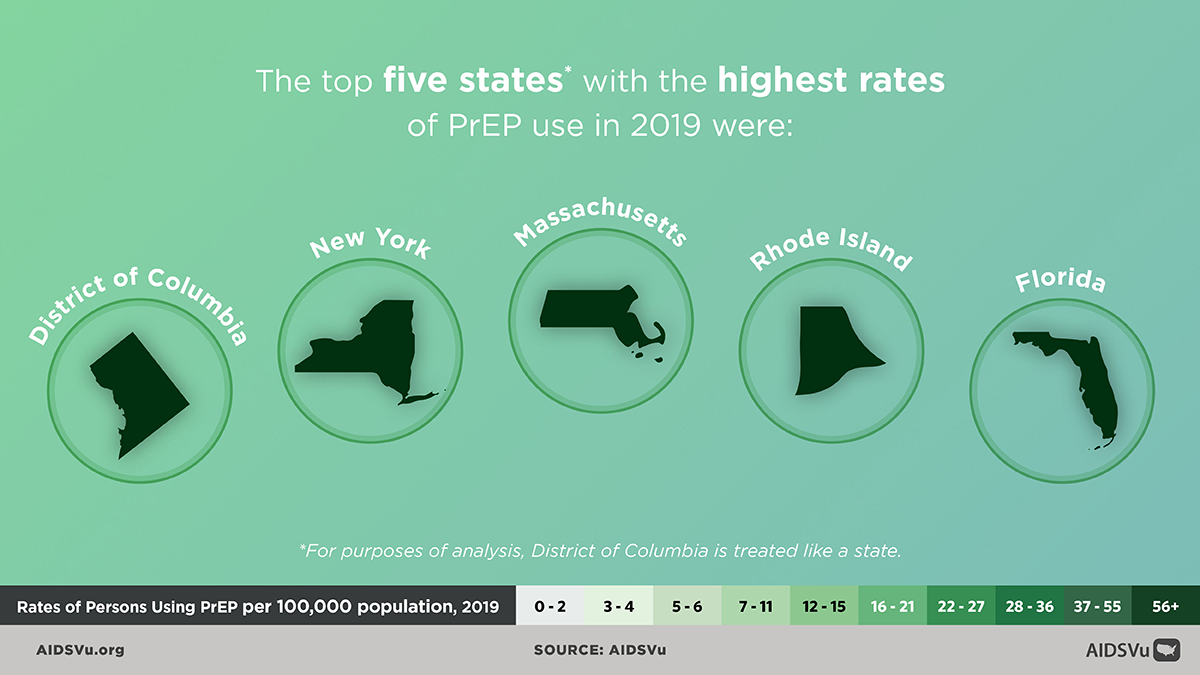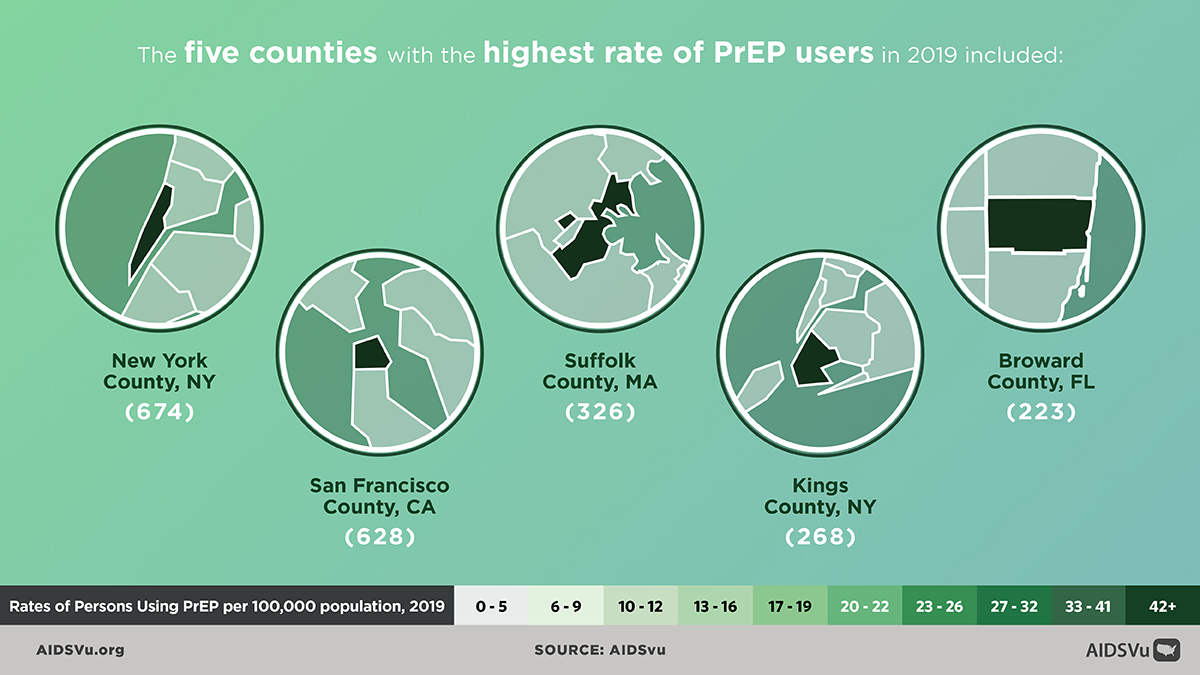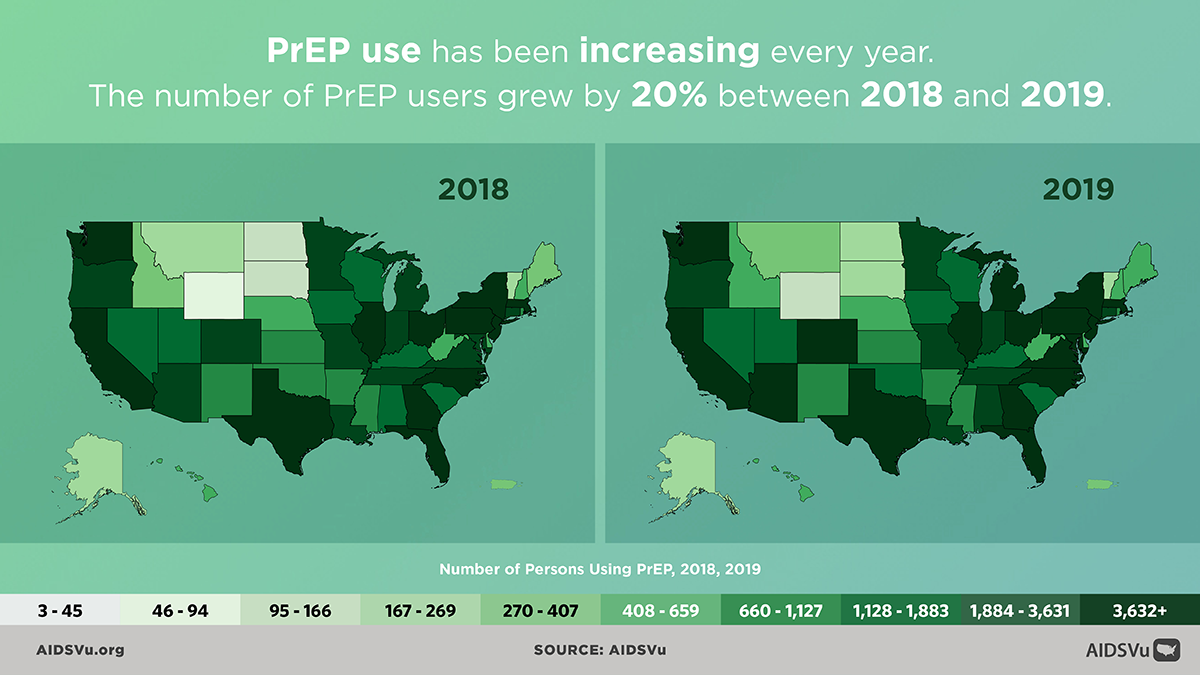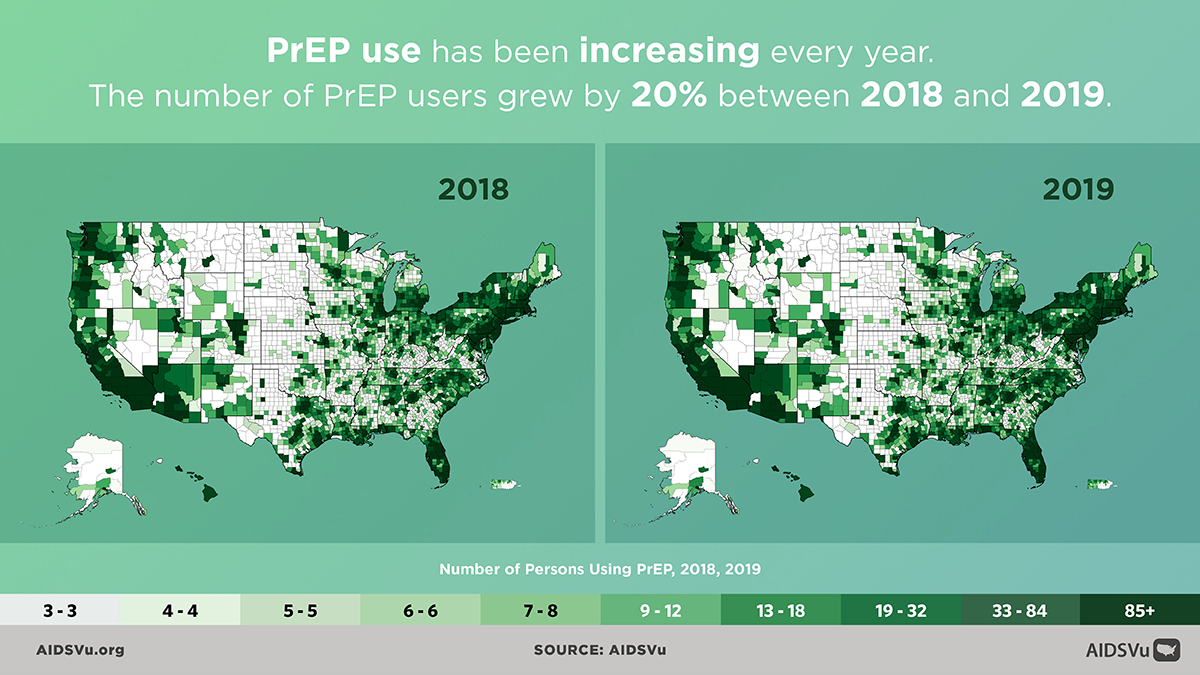
The PrEP utilization data on AIDSVu show continued increases in PrEP use across the U.S., including a 10% increase from 2024 to 2025. While these data point to continued growth nationwide, they also show that progress has slowed, with the smallest annual increase in PrEP users since 2019 to 2020.
These data also highlight persistent disparities in PrEP use across sex, race/ethnicity, age, geography, socioeconomic status, and access to care.
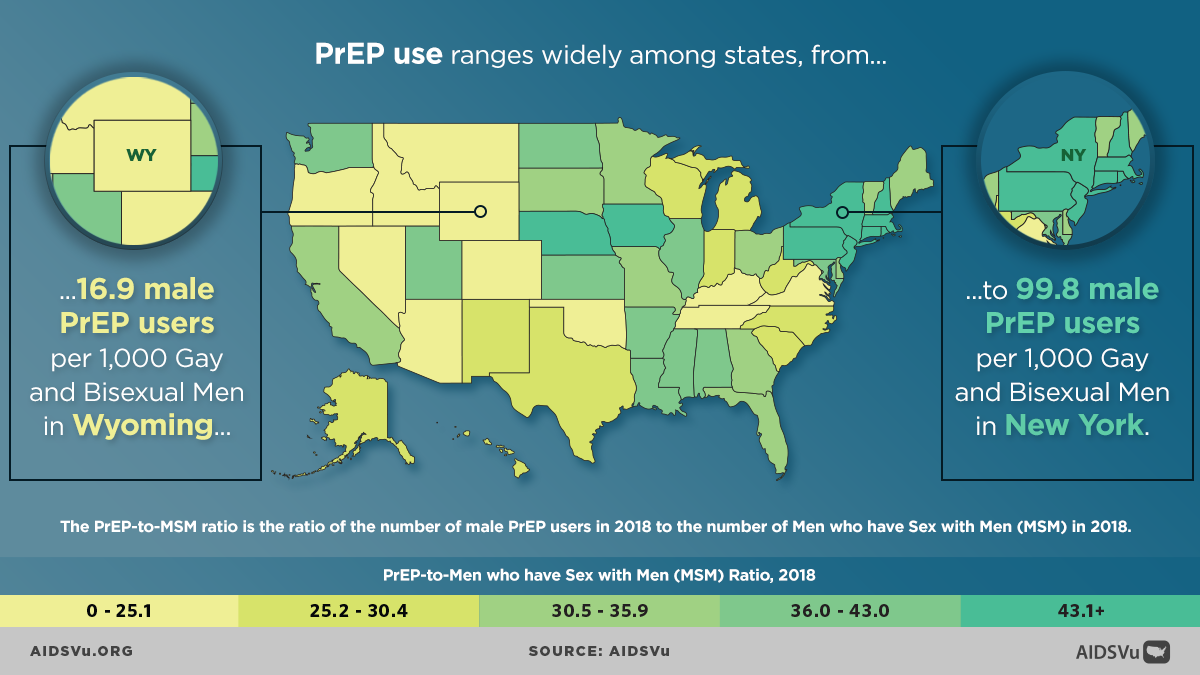
AIDSVu’s PrEP data provide a reliable and consistent metric for PrEP users in counties and states across the U.S. by year from 2012 to 2025. These data can be stratified by age and sex. State-level maps can also be stratified by race/ethnicity for Black, Hispanic, and white individuals. These data and maps offer comparative information and tools to help public health officials, policymakers, researchers, and community leaders inform efforts to increase PrEP awareness and access where it is needed most.
Please see the Data Methods page for additional information on the data set and its limitations.
What is PrEP?
PrEP, or pre-exposure prophylaxis, significantly reduces an individual’s chances of getting HIV. When taken as prescribed, PrEP is highly effective for preventing HIV.
- Pre = before
- Exposure = coming into contact with HIV
- Prophylaxis = treatment to prevent an infection from happening
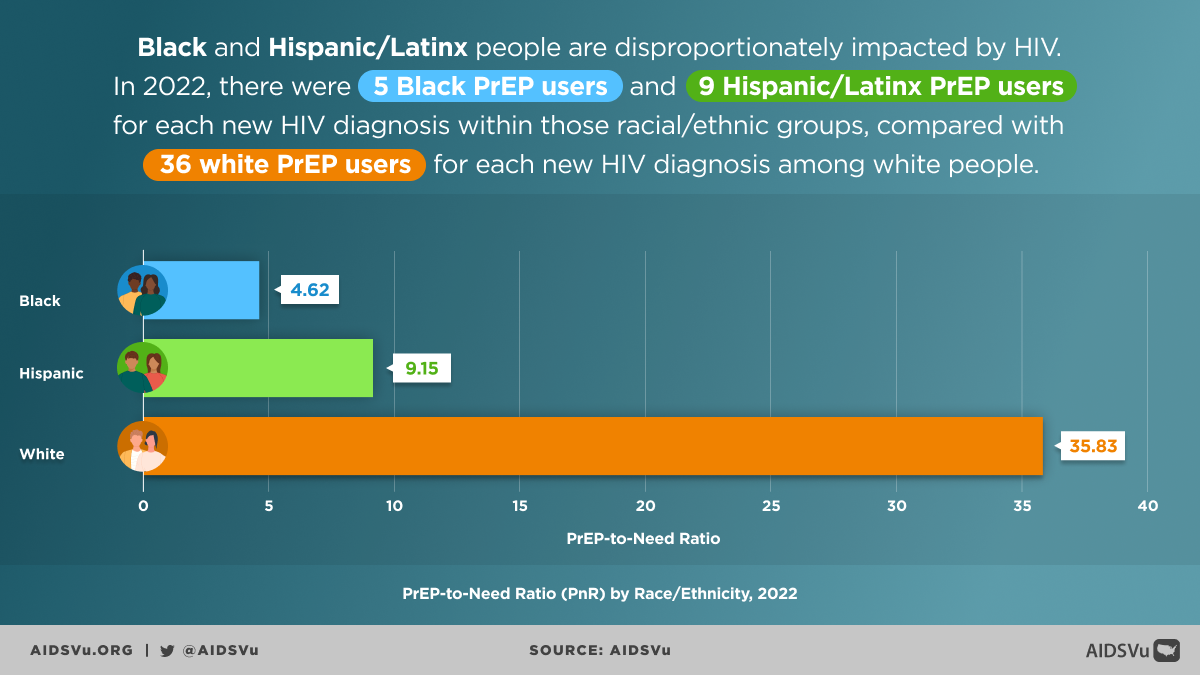
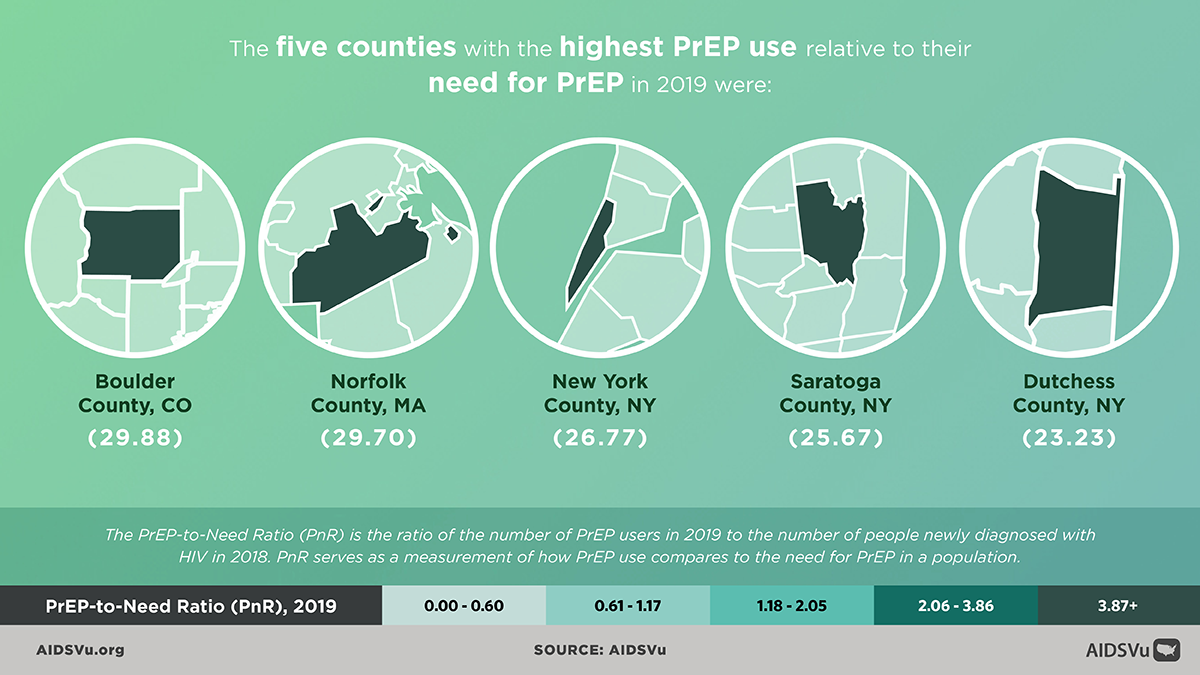
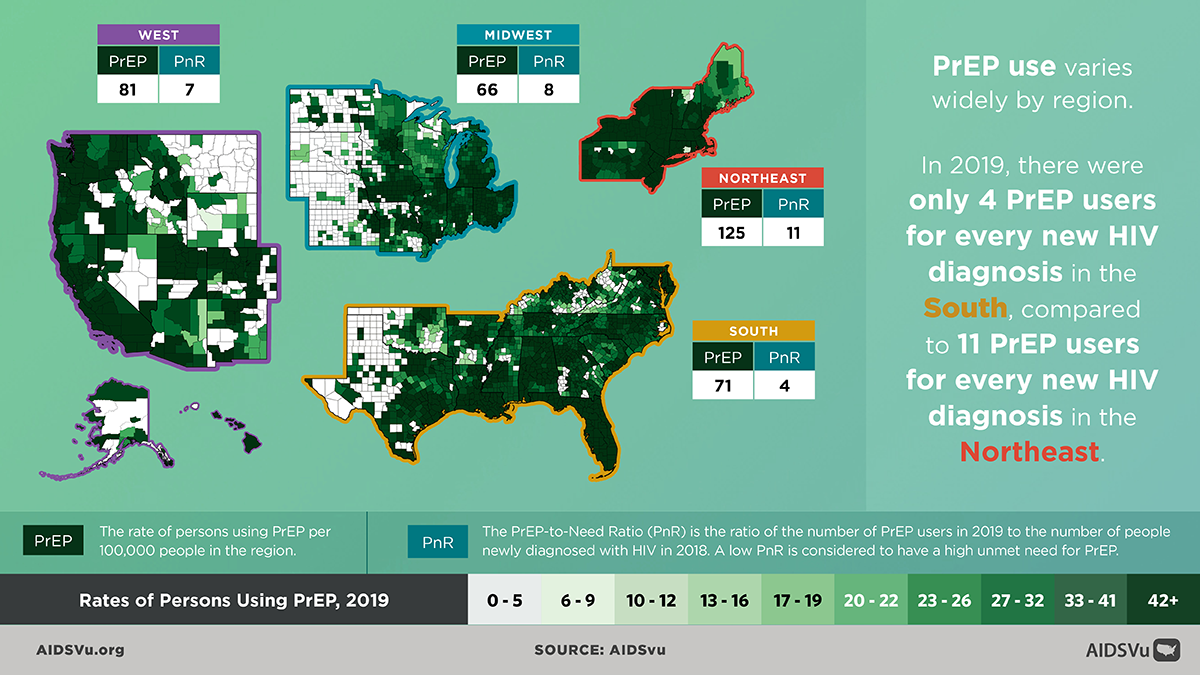
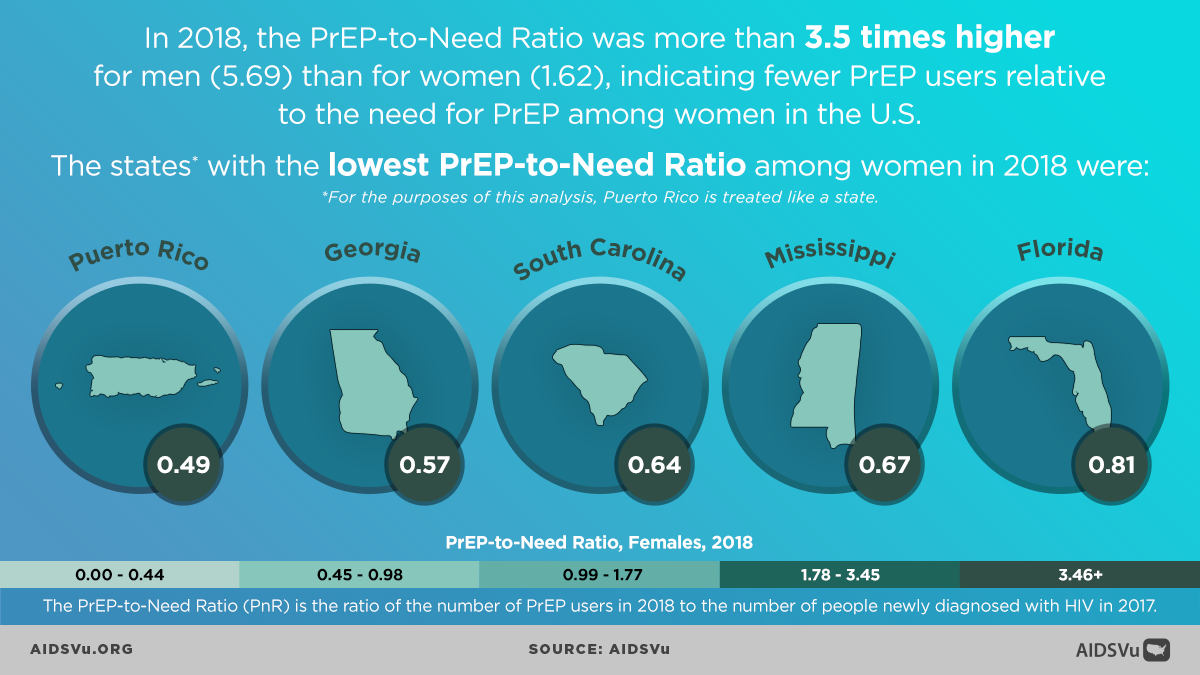
The PrEP-to-Need Ratio, or PnR, is the ratio of the number of PrEP users to the number of people newly diagnosed with HIV. It serves as a measurement for whether PrEP use appropriately reflects the need for HIV prevention in a geographic region or demographic subgroup. A lower PnR indicates more unmet need for PrEP.
Note: 2025 and 2024 PnR were calculated using 2023 new diagnoses as the denominator.
The PrEP-to-Need Ratio, Explained
Using the PrEP Data
Public Health Officials & Policy Makers
Understand local PrEP use and disparities in use to help inform data-driven policies and programs to increase awareness of and access to PrEP.
Researchers
Identify trends and gaps in PrEP access, outline facilitators and barriers to PrEP expansion, and determine areas for further exploration.
Utilize data and maps to assist with planning processes, resource allocation, presentations, grant writing and review.
Community
Raise awareness of PrEP use in your community and the need to expand the use of PrEP among those at high risk of getting HIV.
Educate your elected officials and encourage policy change to increase PrEP awareness and access.
What These Data Tell Us
What do the PrEP use data reveal?
PrEP use data are from 2025, and new HIV diagnoses data are from 2024, unless otherwise noted.
Overall PrEP Use
- The number of PrEP users in the U.S. increased by 10% from 2024 to 2025, continuing a trend of growth in PrEP use since 2012.
- However, the 10% increase from 2024 to 2025 was the smallest annual increase in PrEP users since 2019 to 2020, indicating that progress in expanding PrEP use may be slowing.
- Nationally, there were approximately 16 PrEP users for every new HIV diagnosis.
PrEP Use by Race/Ethnicity
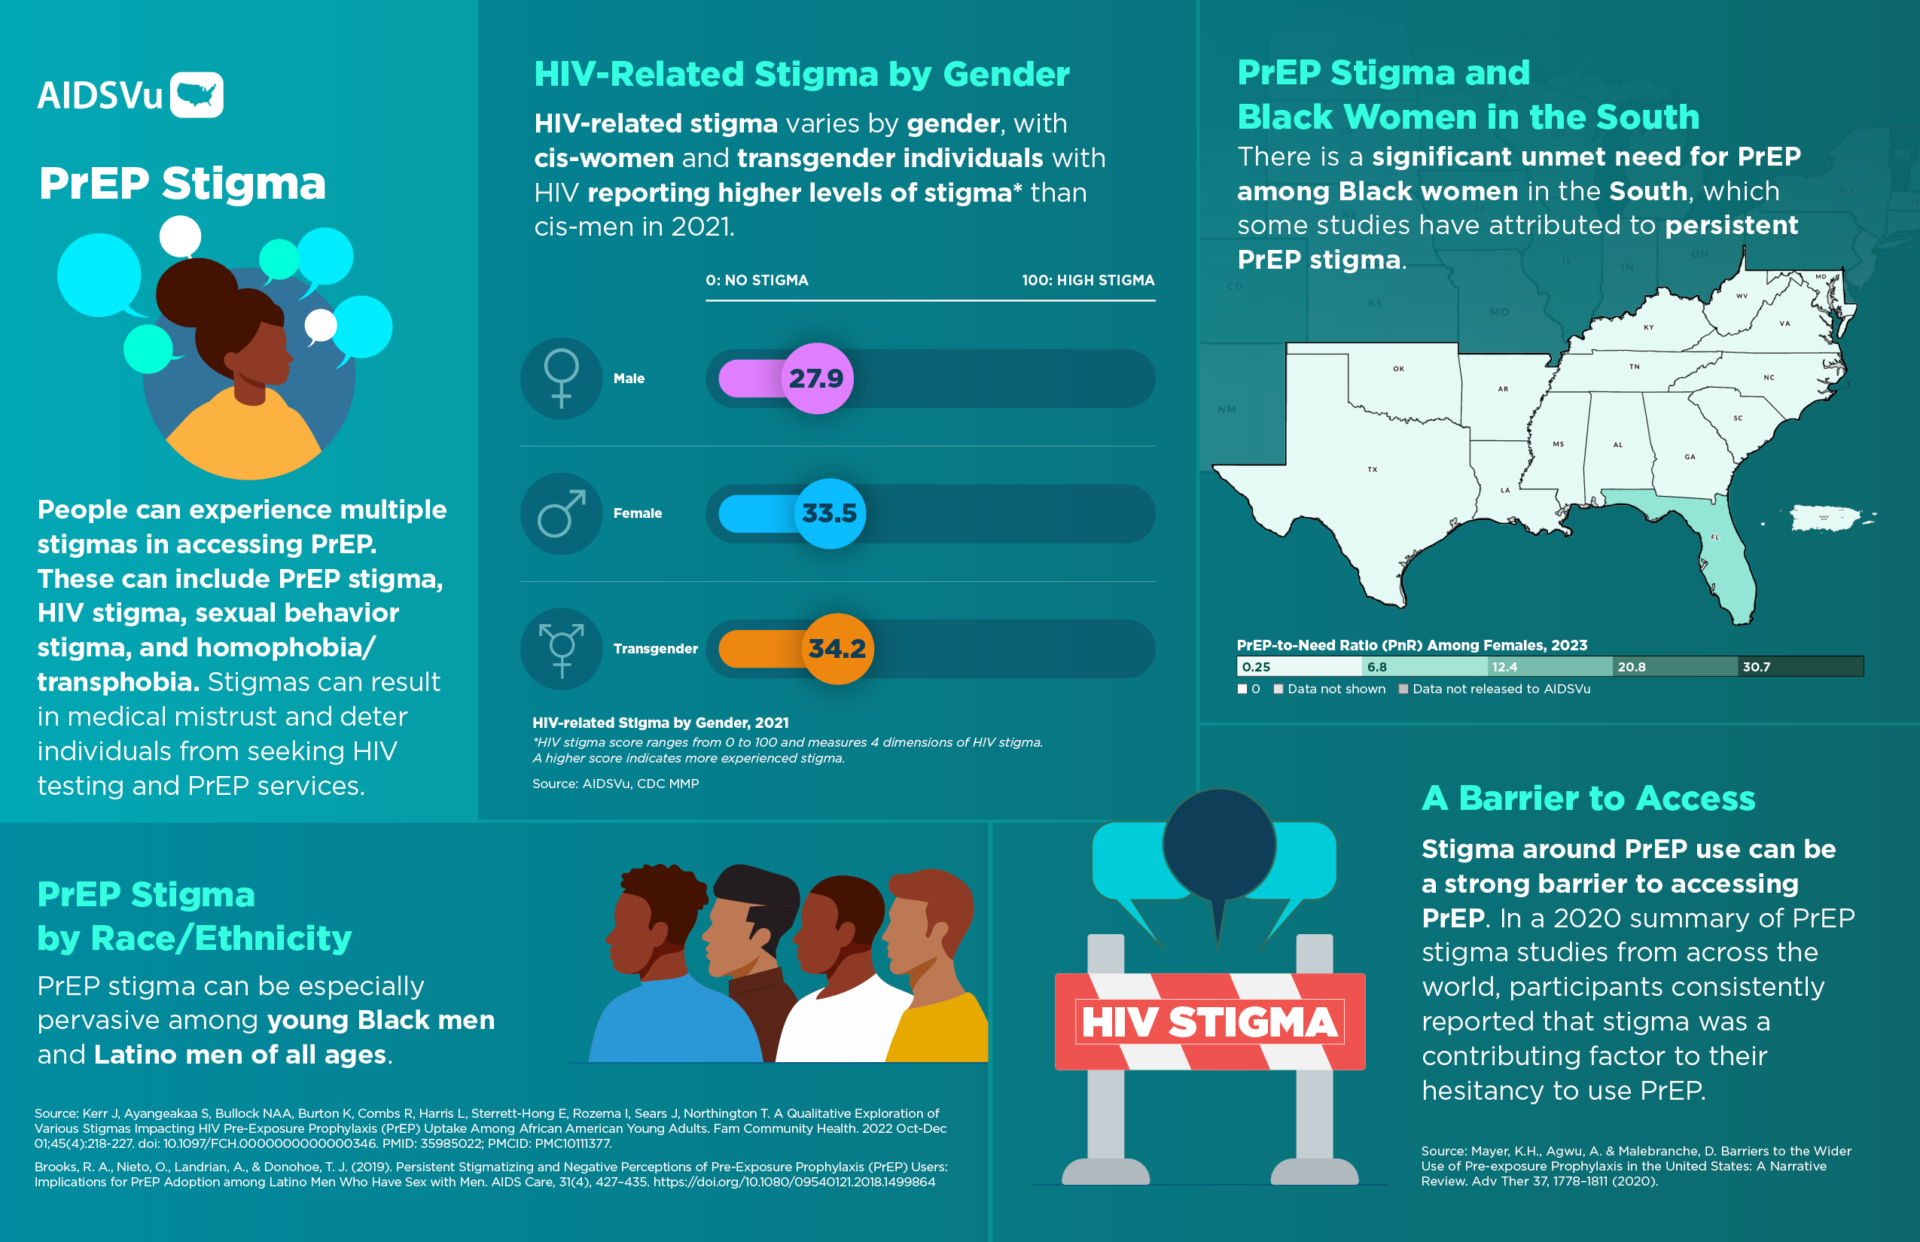
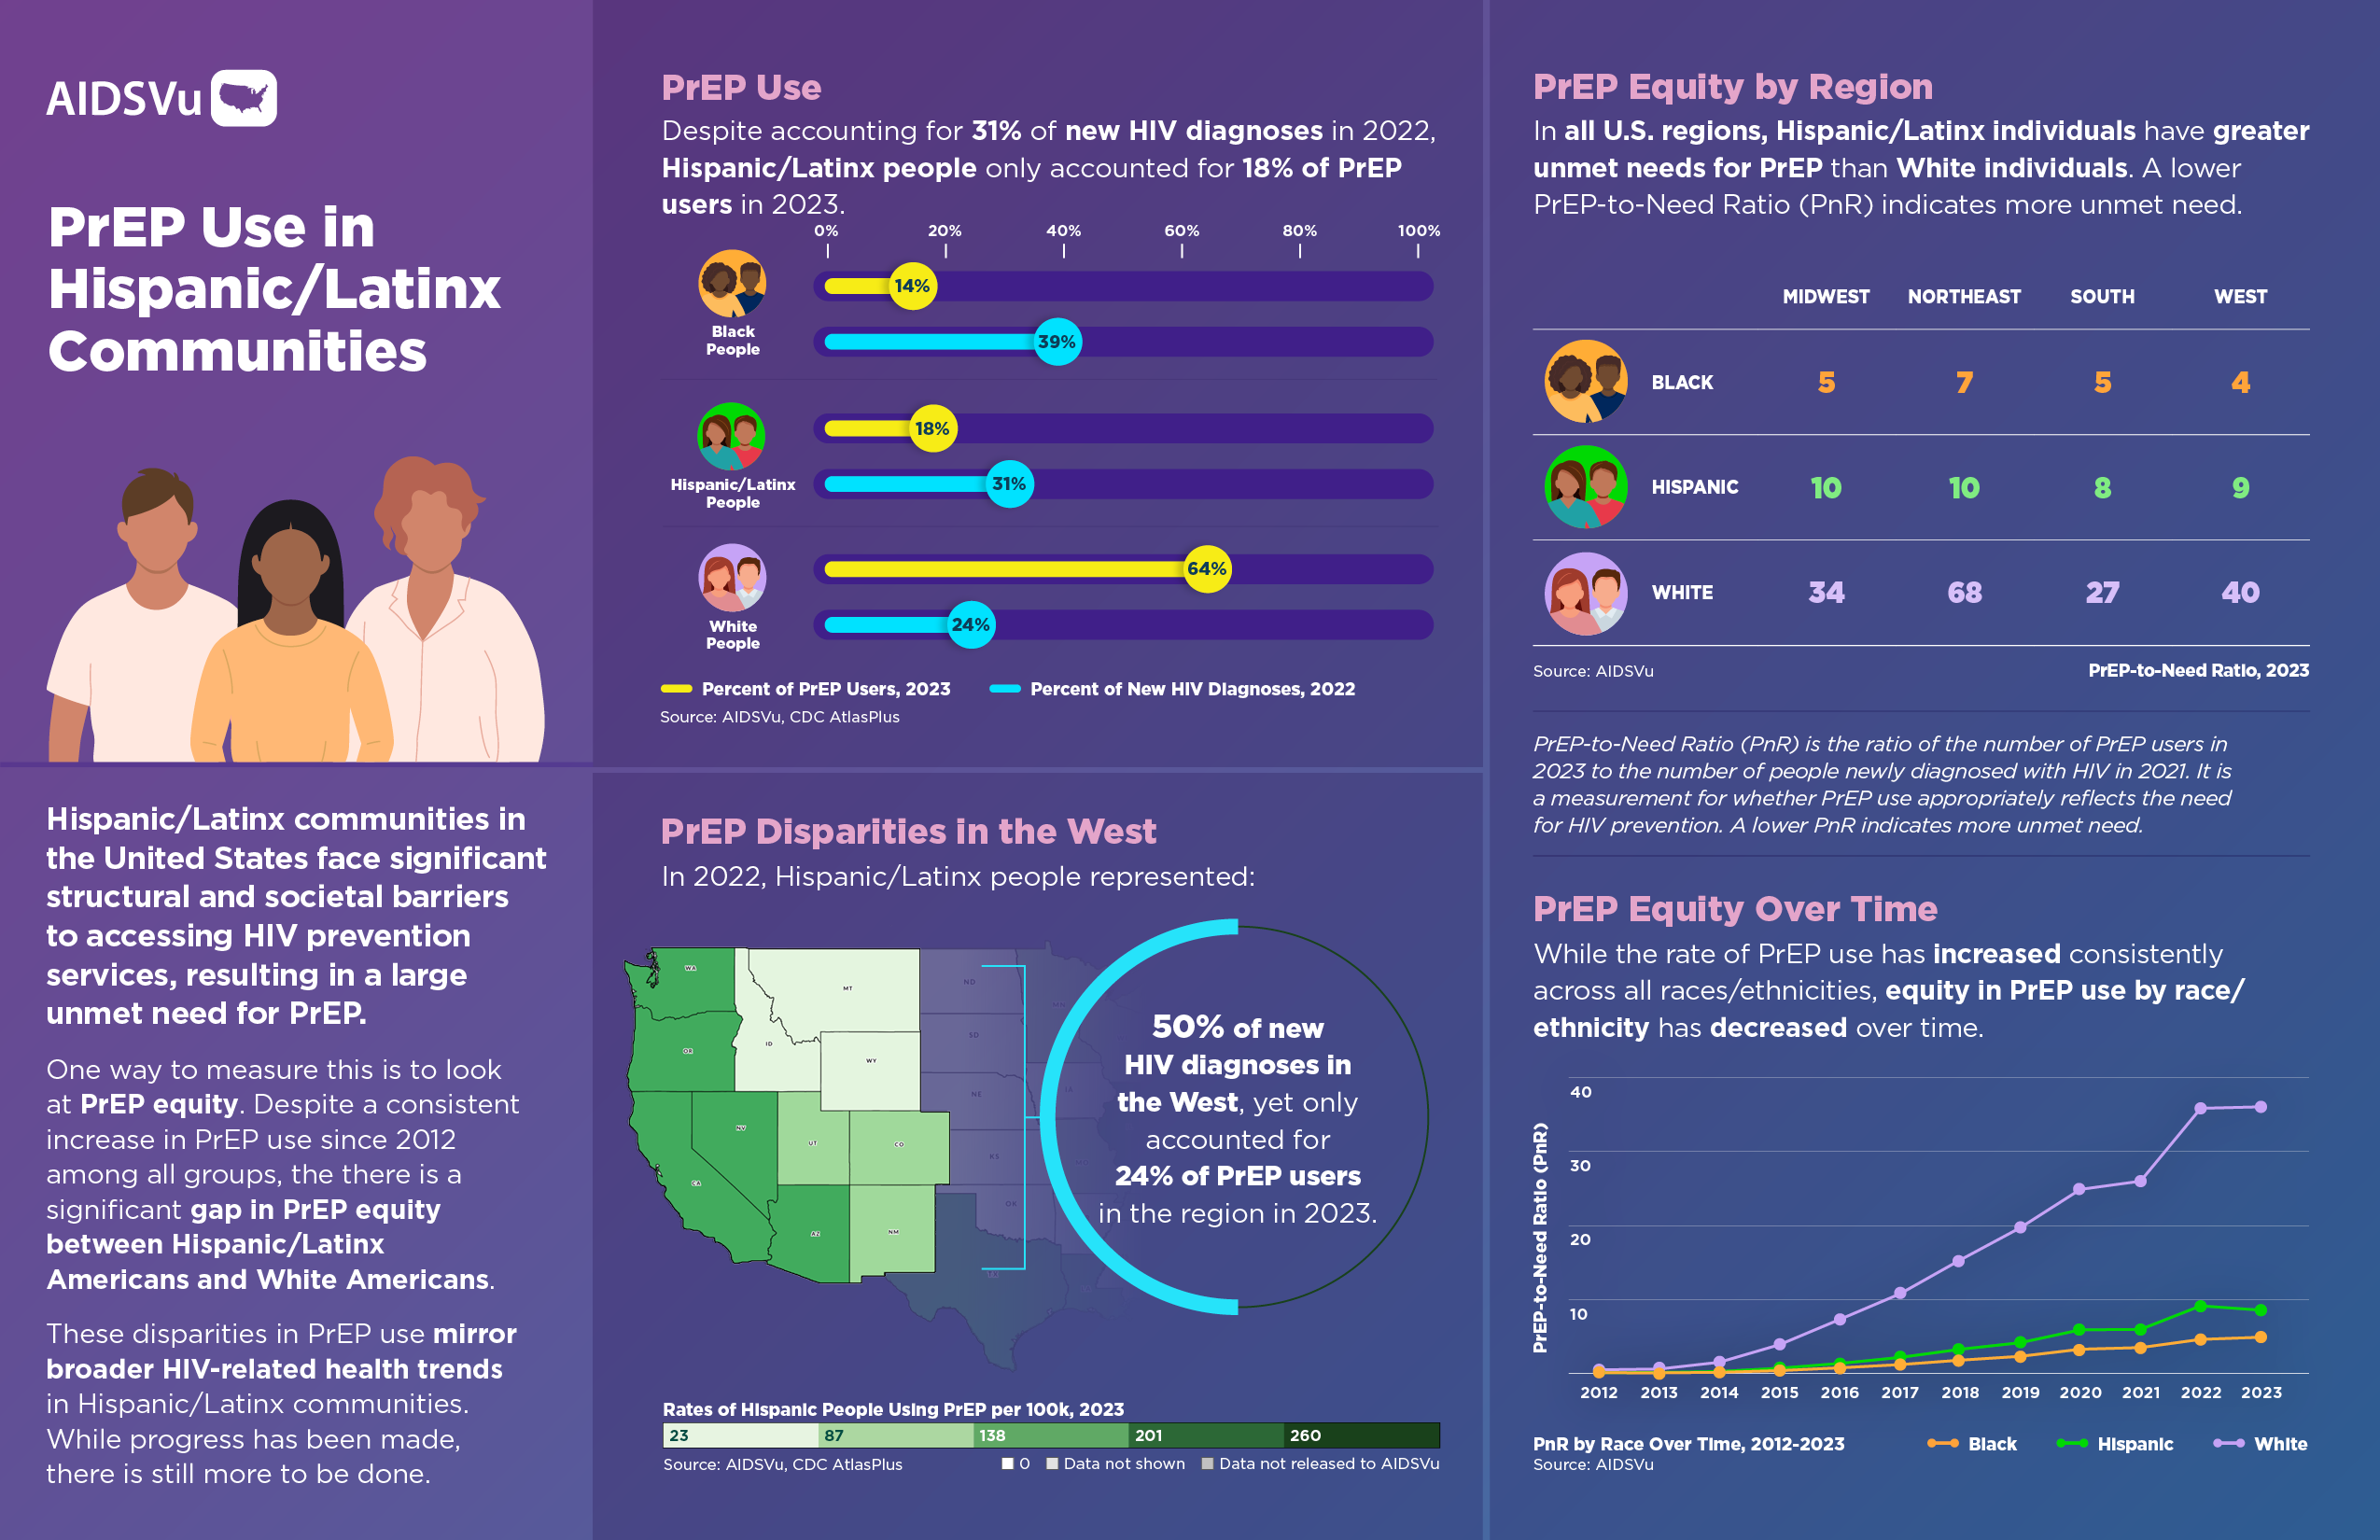
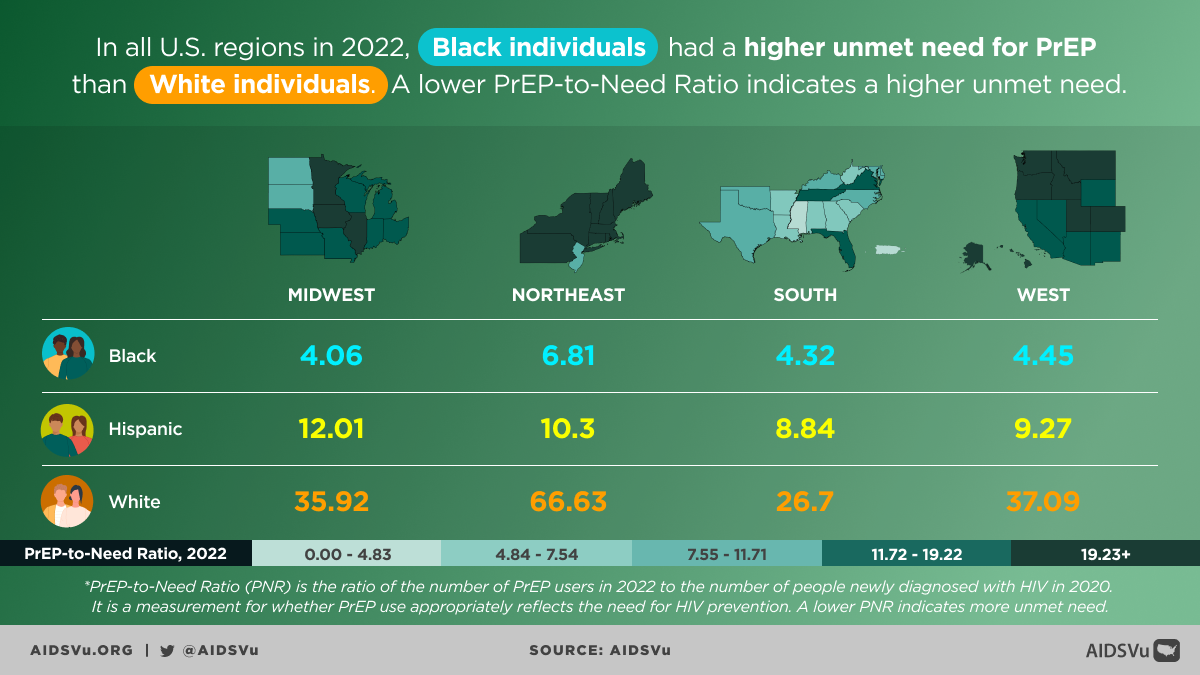
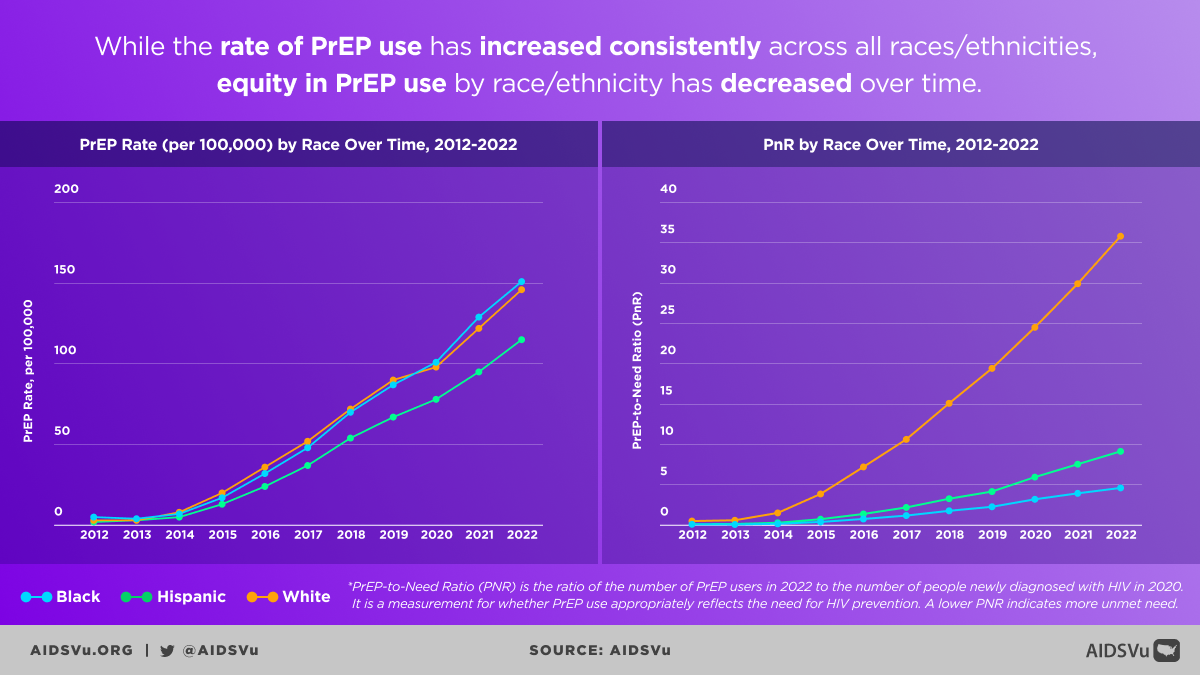
- PrEP rates and PrEP-to-Need Ratios continued to increase between 2012 and 2025 for Black, Hispanic, and white people. However, major disparities remain.
- In 2025, the PrEP-to-Need Ratio for white people was much higher than the PnR for Hispanic and Black people.
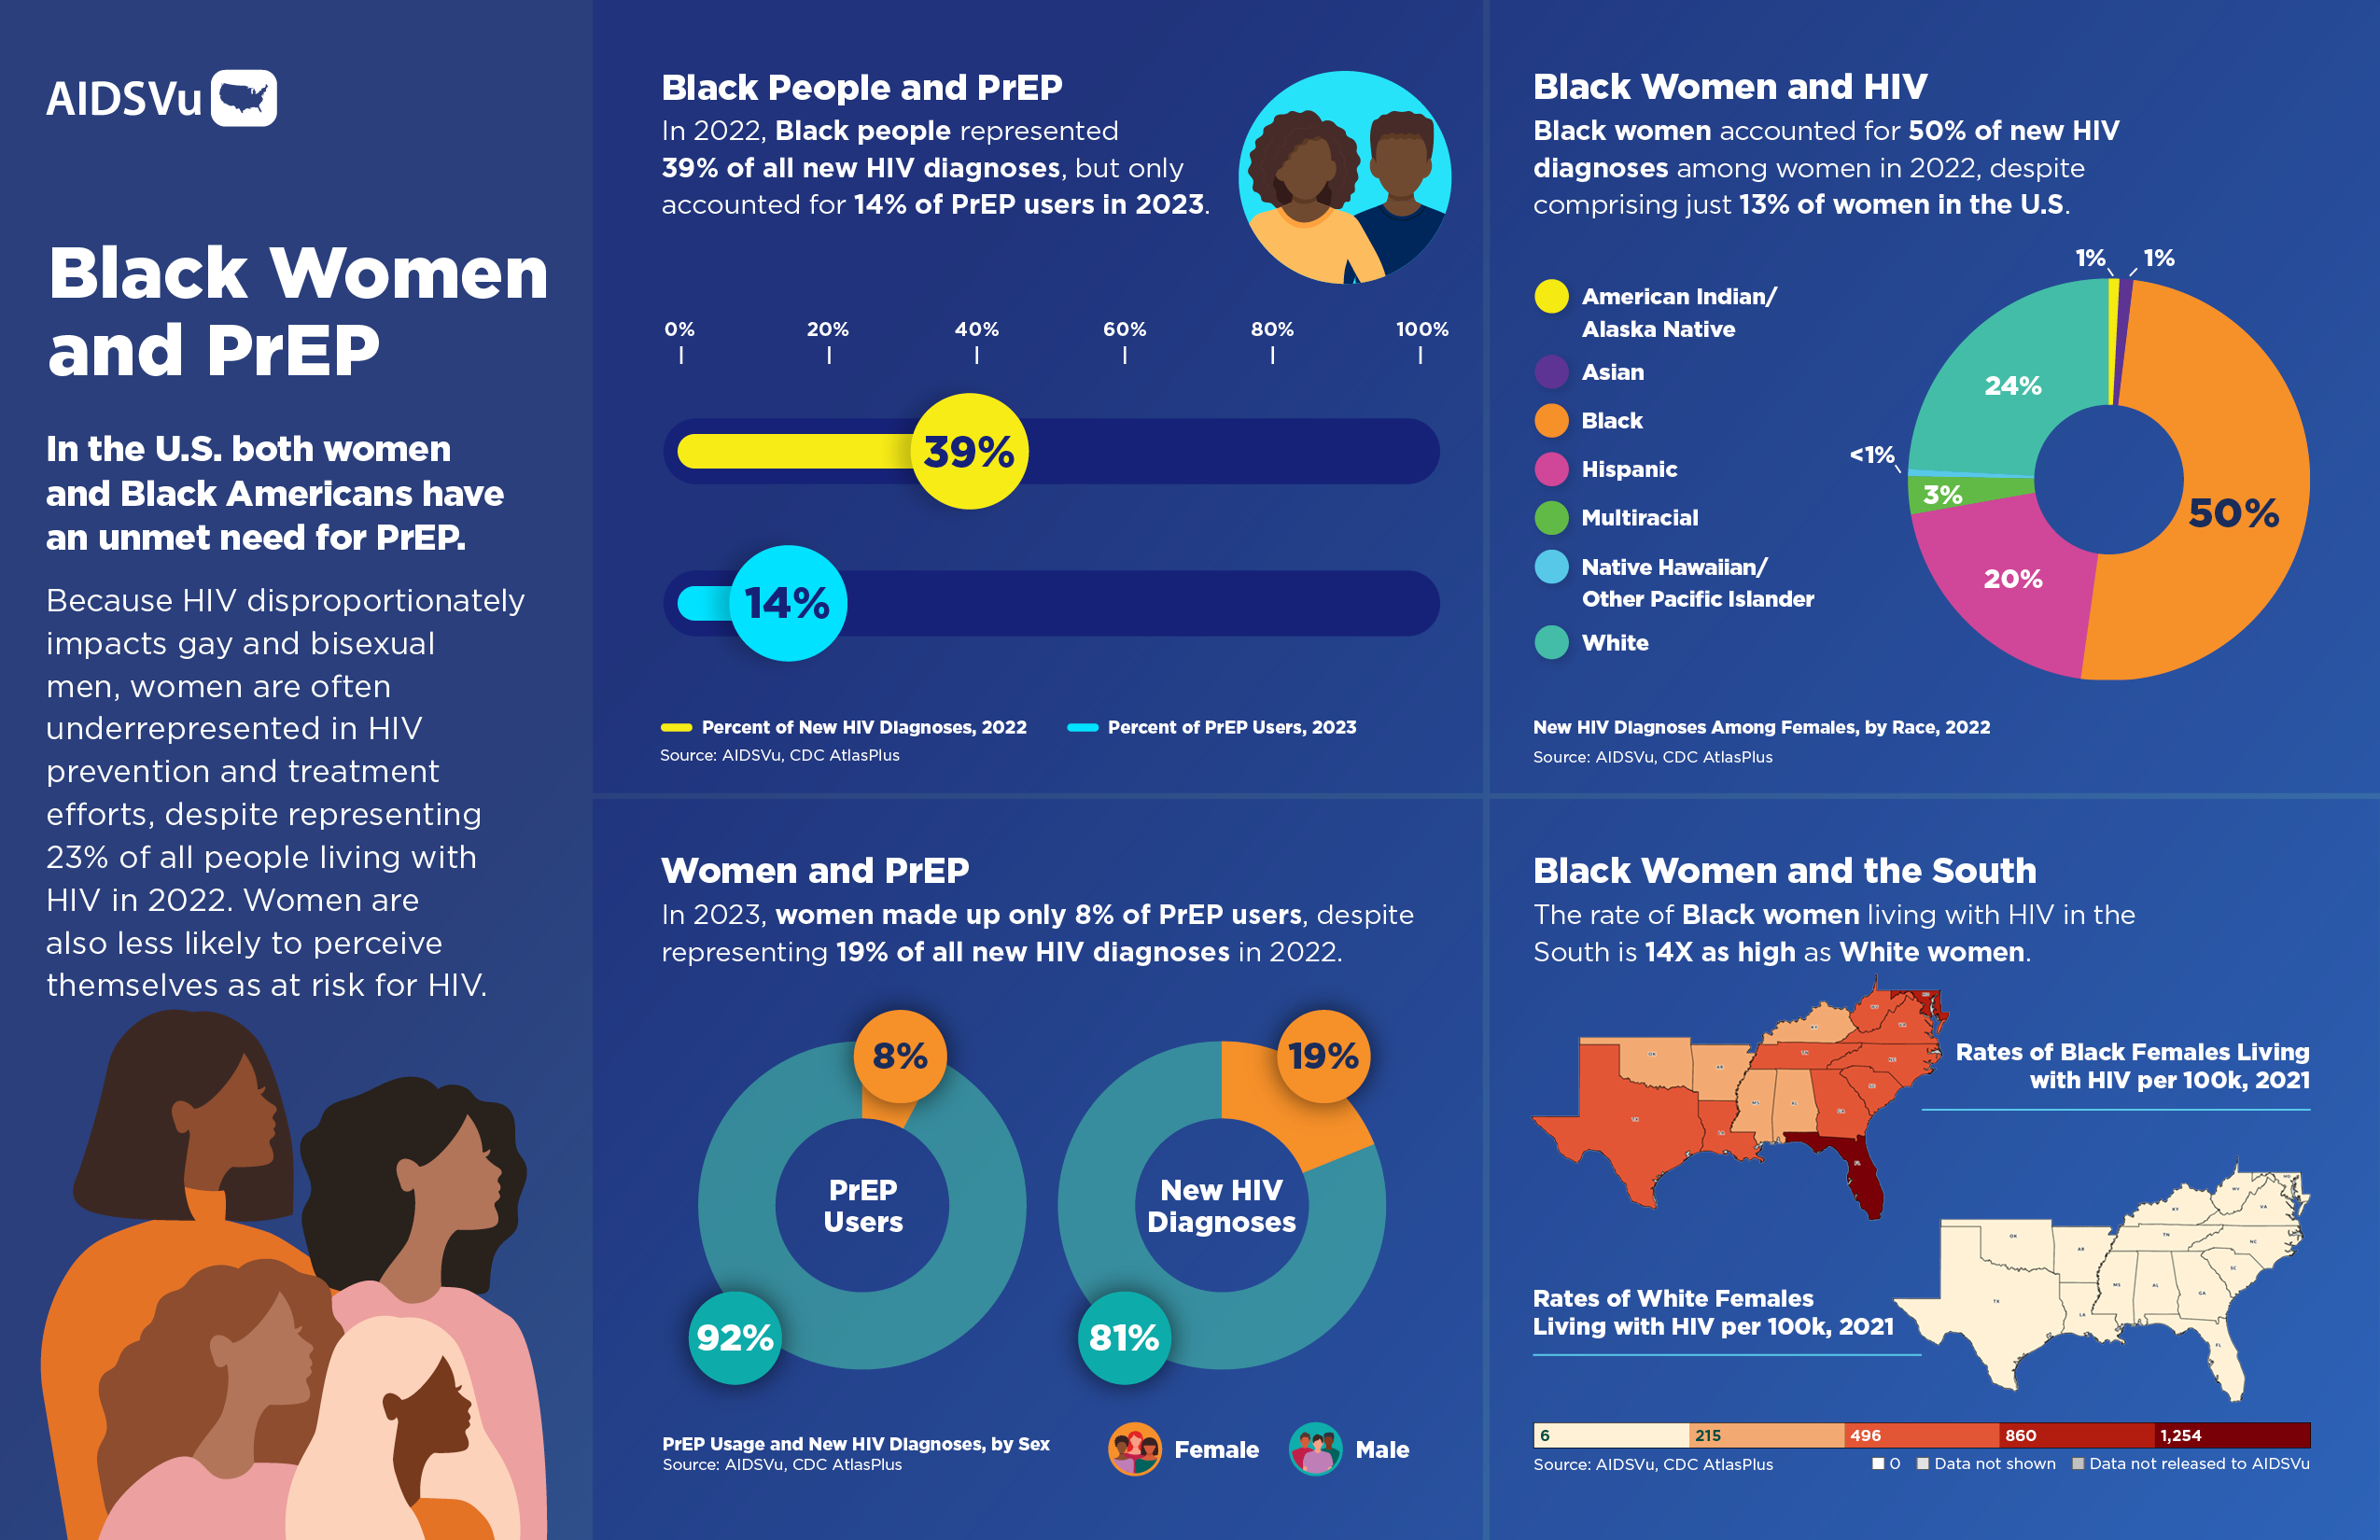
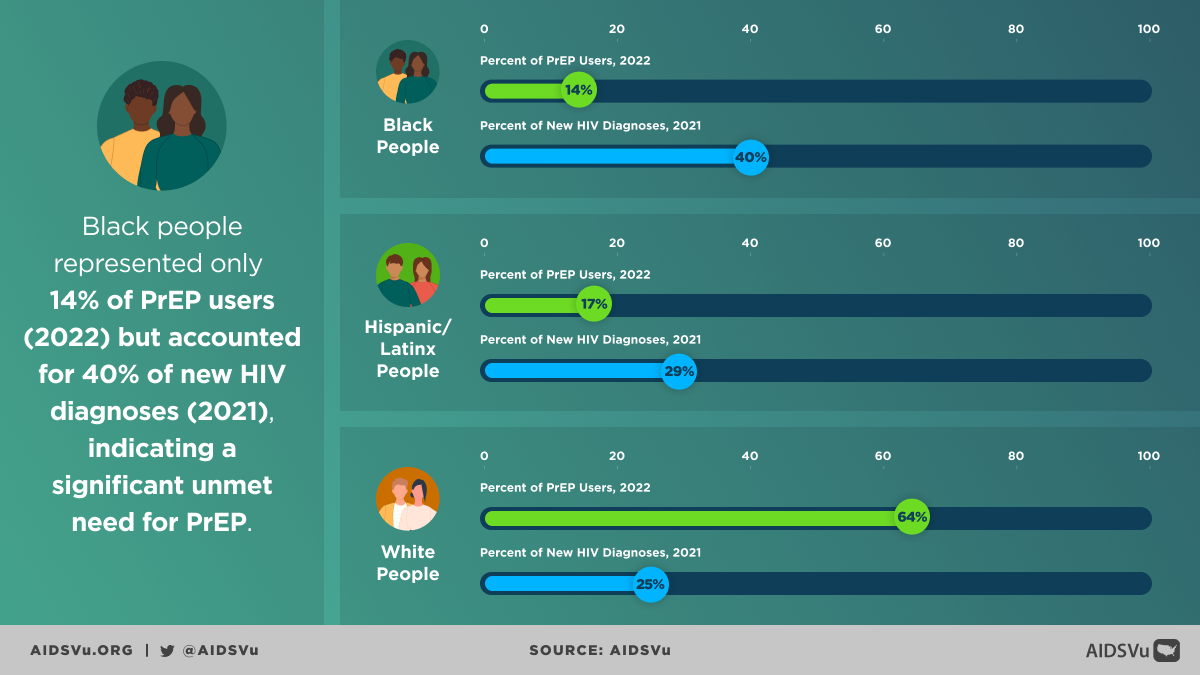
- Black people represented 39% of all new HIV diagnoses in 2024, the highest among all racial/ethnic groups, but accounted for only 15% of PrEP users in 2025.
- Hispanic people represented 34% of new HIV diagnoses in 2024 but accounted for only 18% of PrEP users in 2025.
- White people represented 21% of new HIV diagnoses in 2024 but accounted for 63% of all PrEP users in 2025.62% of PrEP users in 2025.
- In 2025, there were more than 200 PrEP users per 100,000 Black, white, and Hispanic people for the first time.
PrEP Use by Age
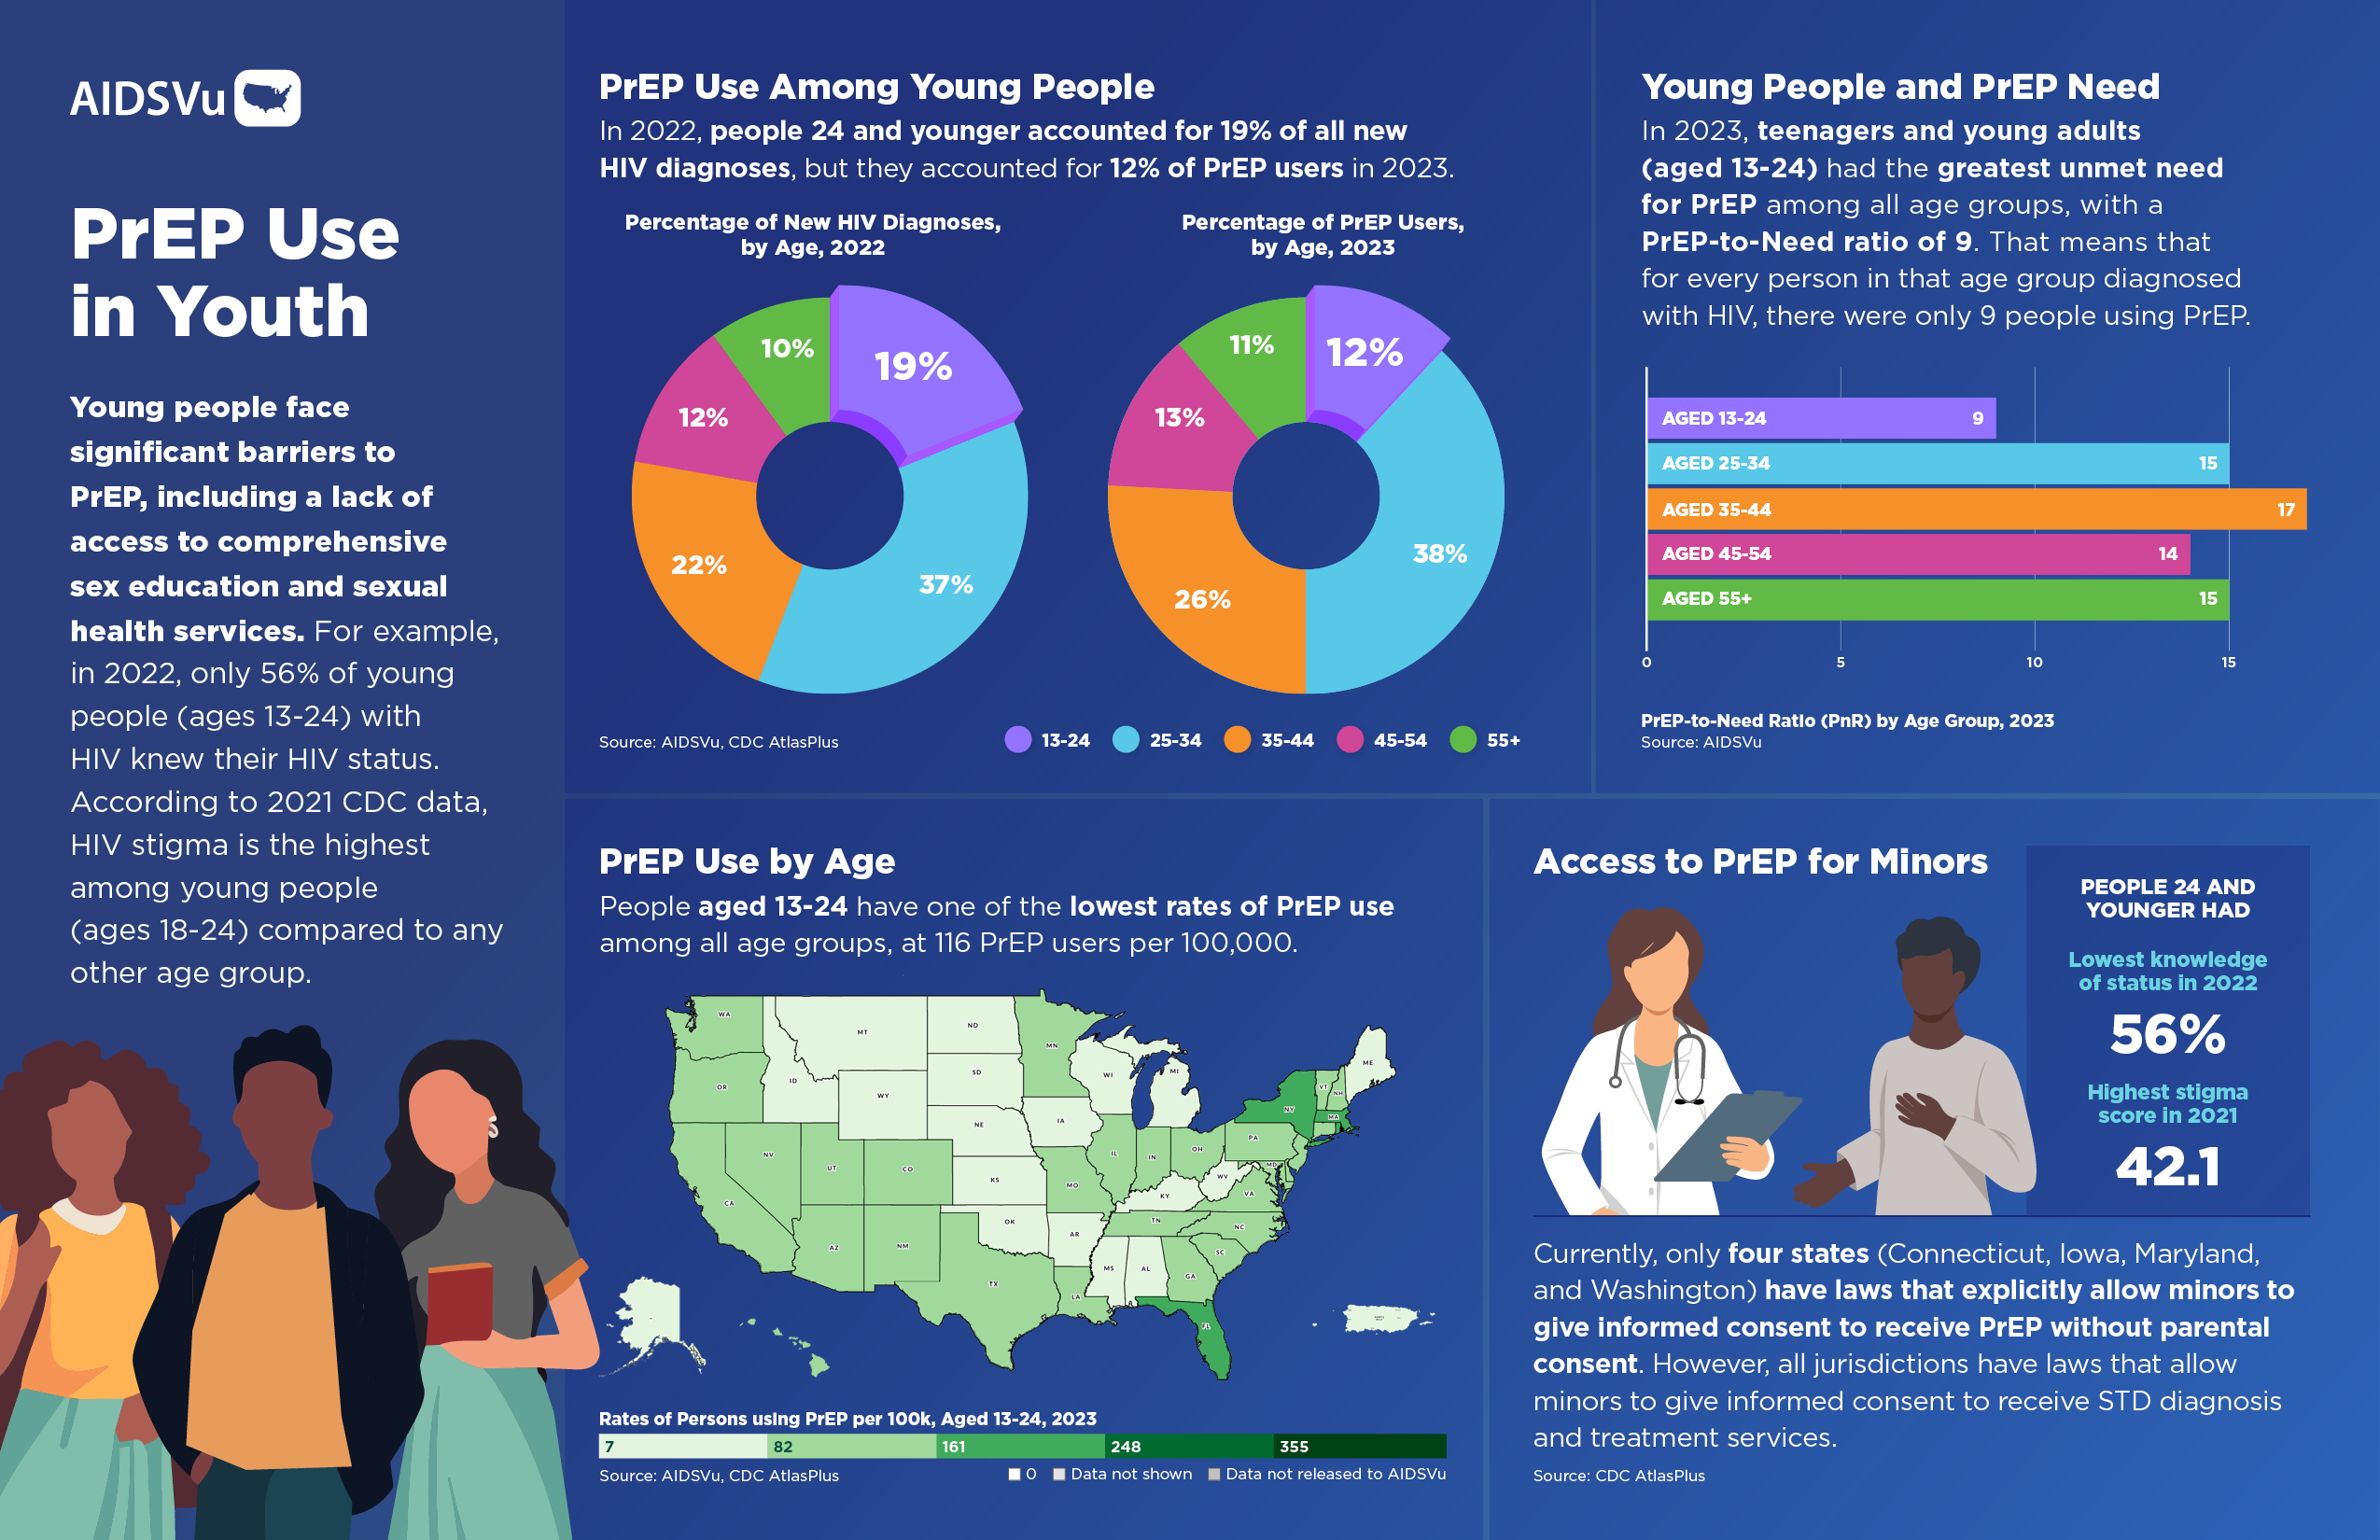
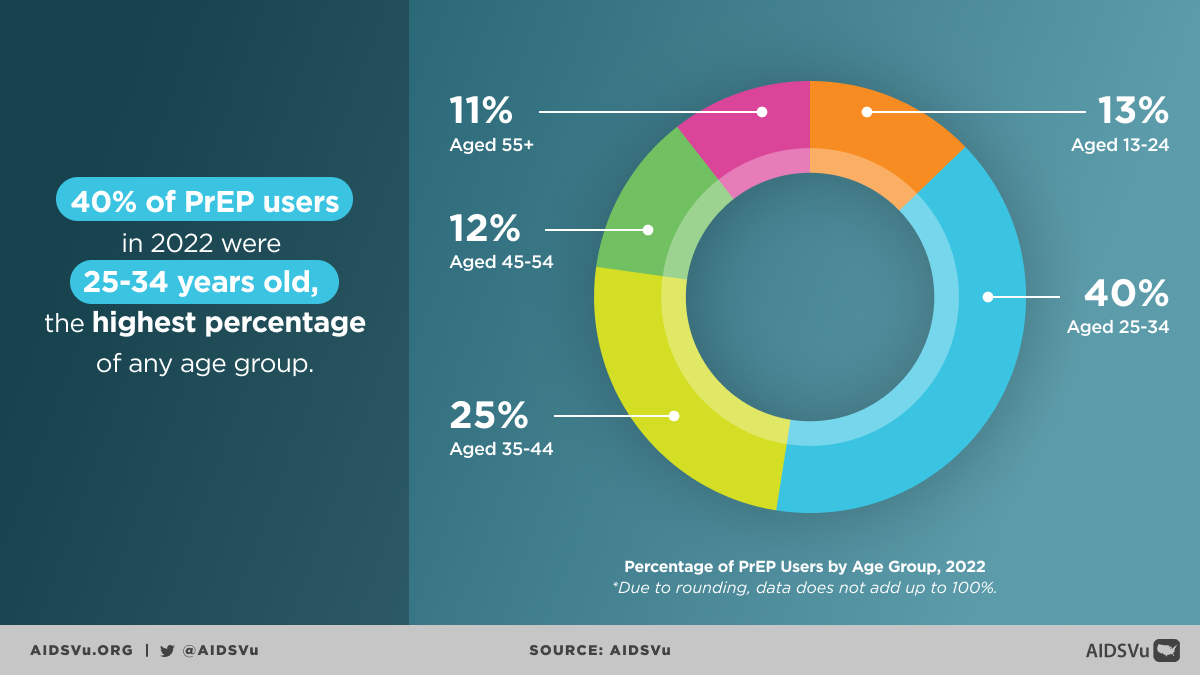
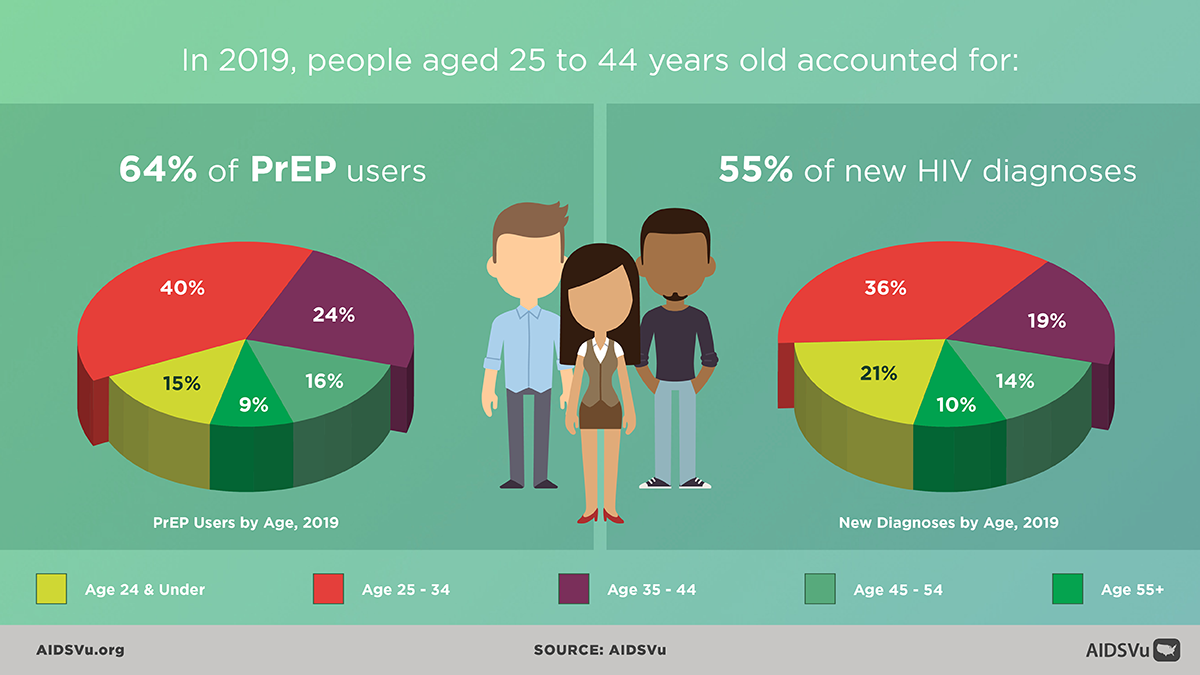
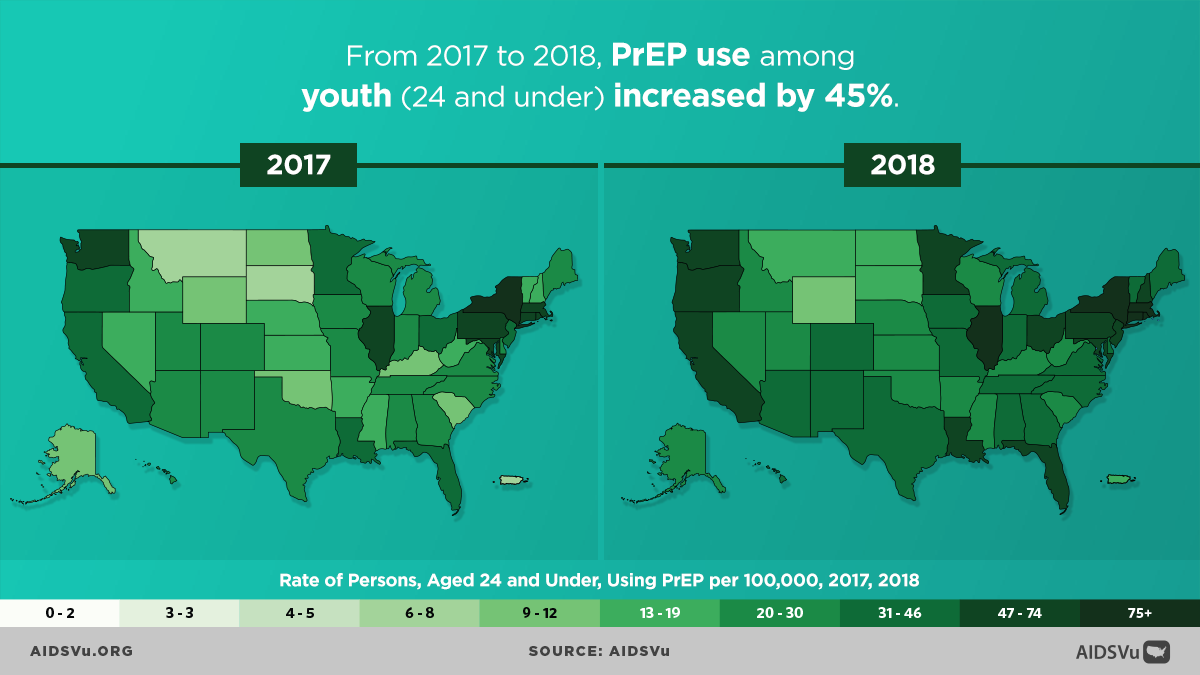
- In 2025, 36% of all PrEP users were ages 25 to 34, and 64% were between ages 25 and 44.
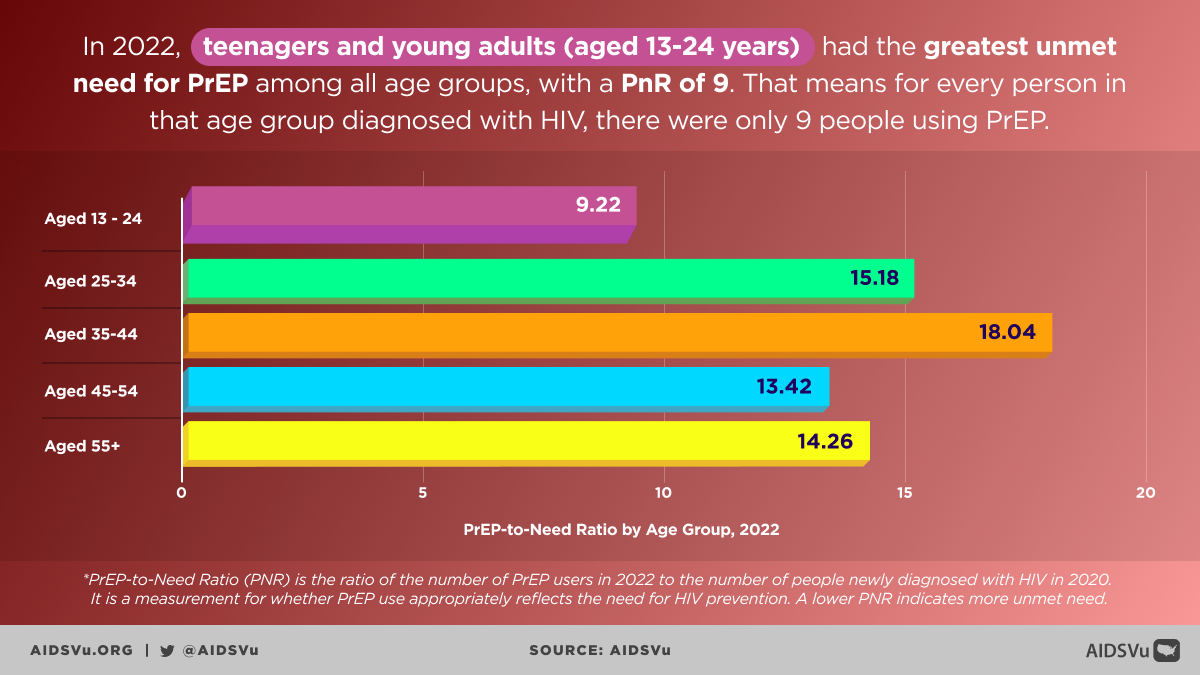
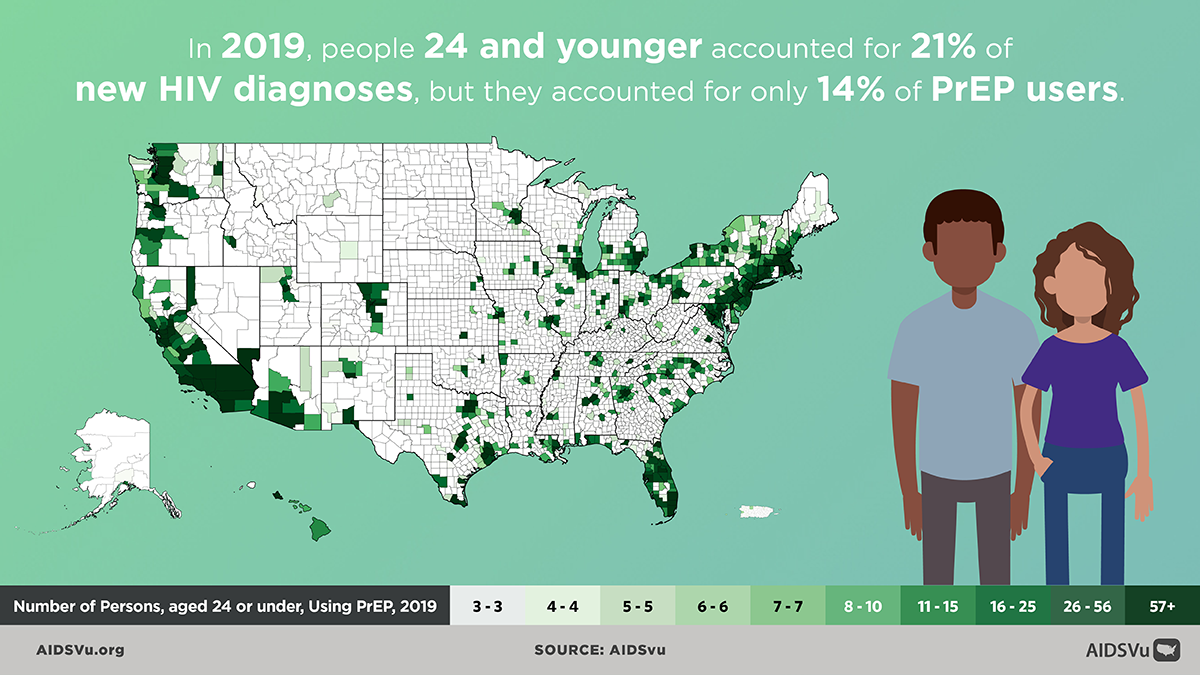
- Teenagers and young adults ages 13 to 24 had the greatest unmet need for PrEP among all age groups, with the lowest PrEP-to-Need Ratio.
- People ages 13 to 24 made up only 10% of all PrEP users in 2025, despite accounting for 18% of new HIV diagnoses in 2024.
- The PrEP-to-Need Ratio was highest among people ages 65 and older and lowest among people ages 13 to 24.
PrEP Use by Sex
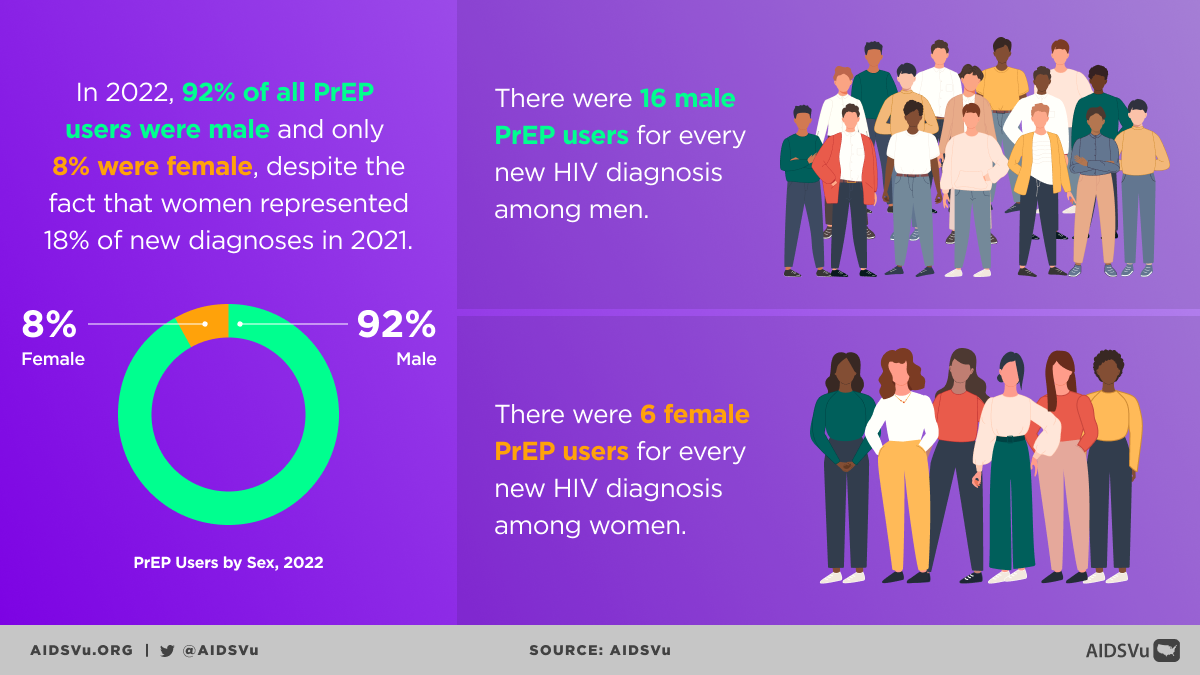
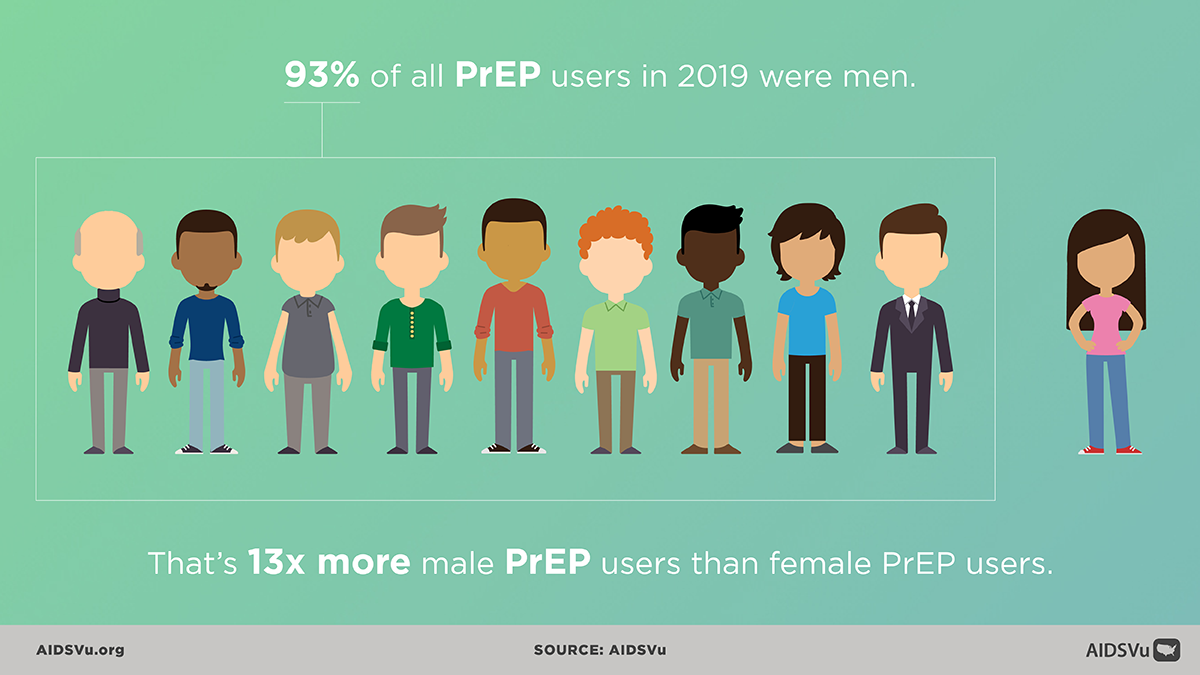
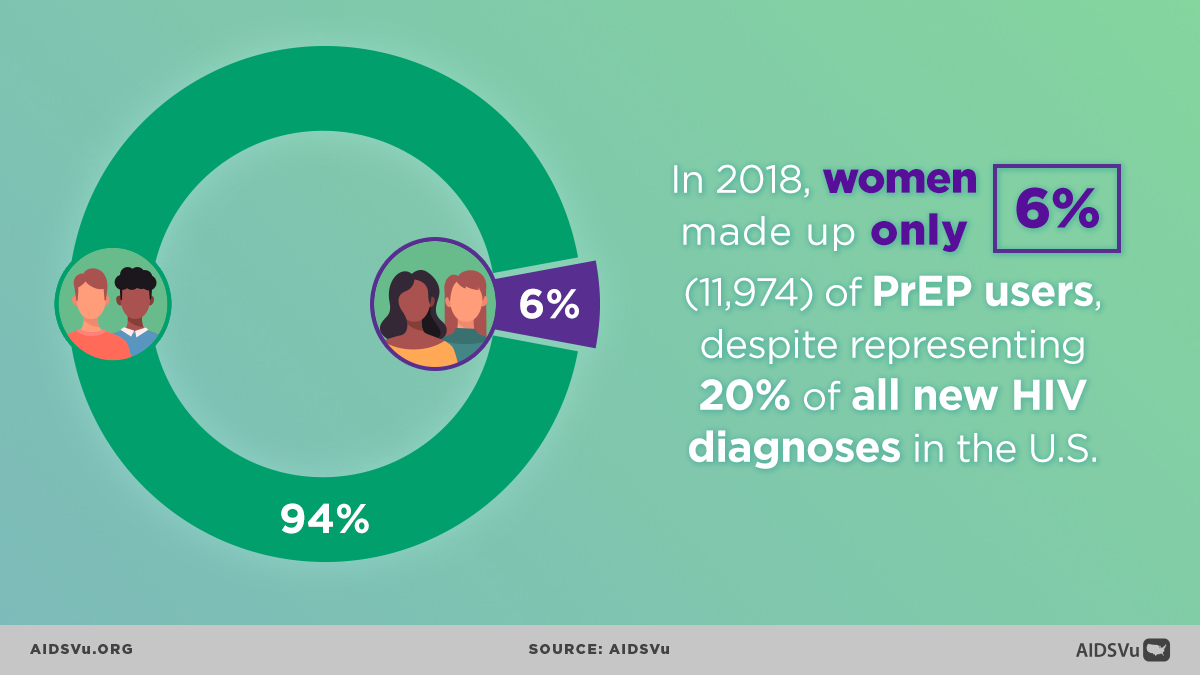
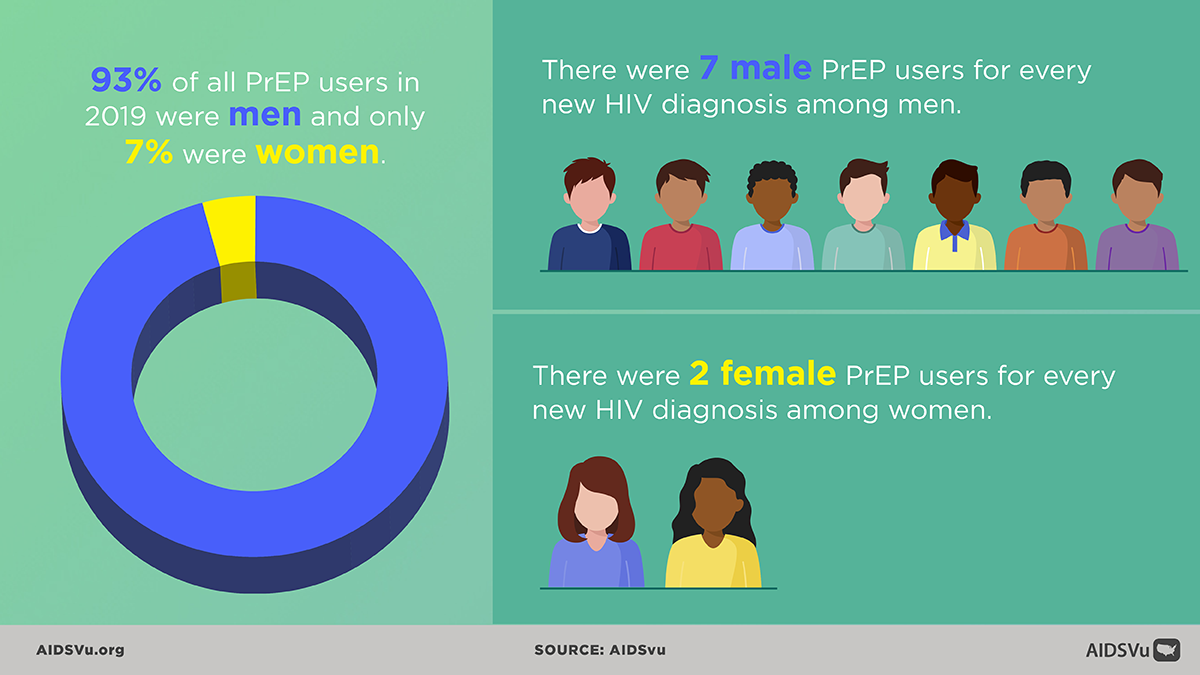
- Among all PrEP users in the U.S., 90% were men and 10% were women.
- Men had a PrEP use rate nine times higher than women and a PrEP-to-Need Ratio more than twice as high.
- Women accounted for 20% of new HIV diagnoses in 2024 but only 10% of PrEP users in 2025, underscoring the need to expand PrEP awareness and access among women.
PrEP Use by Region
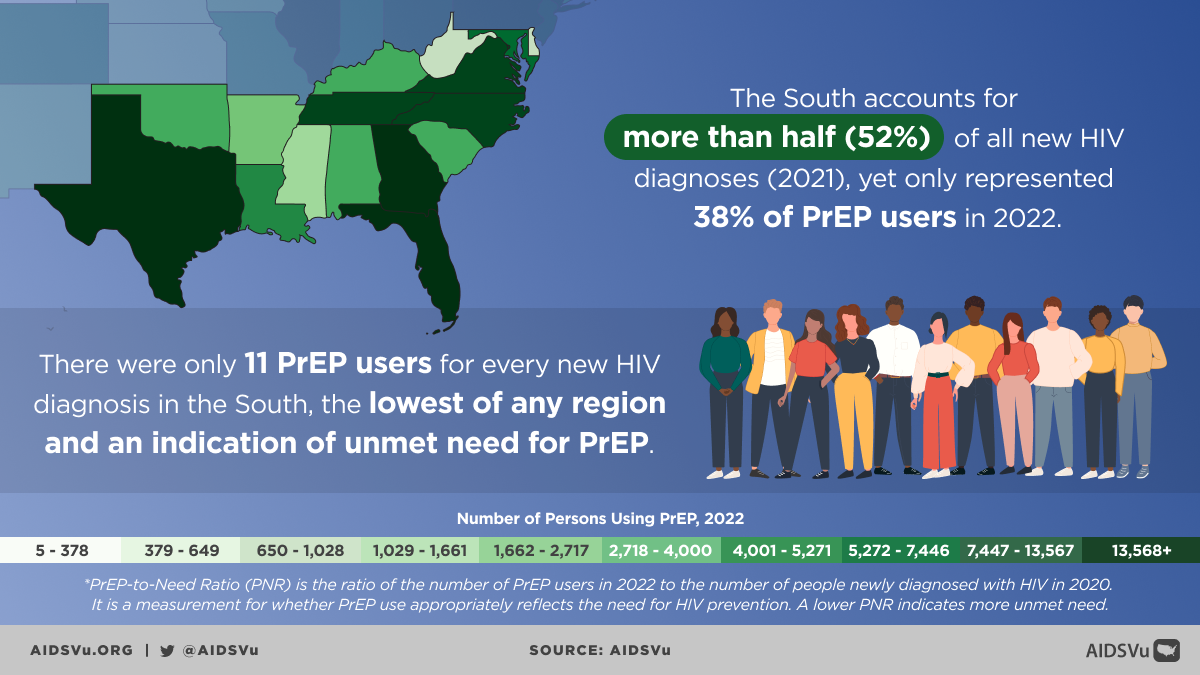
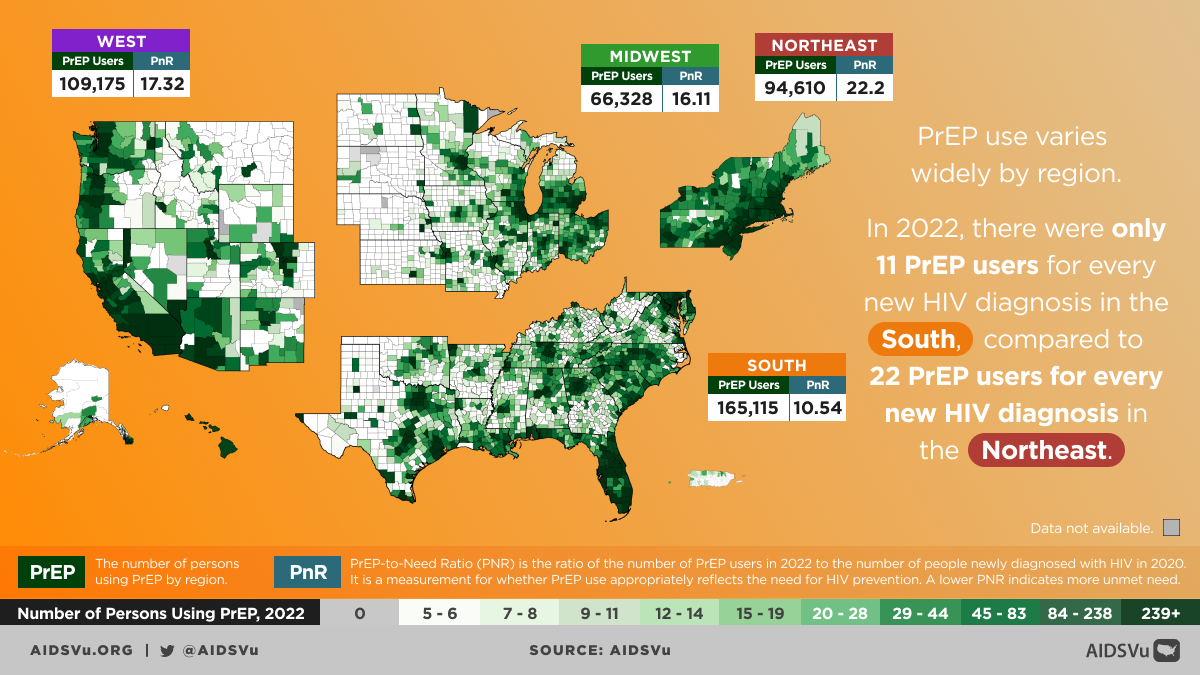
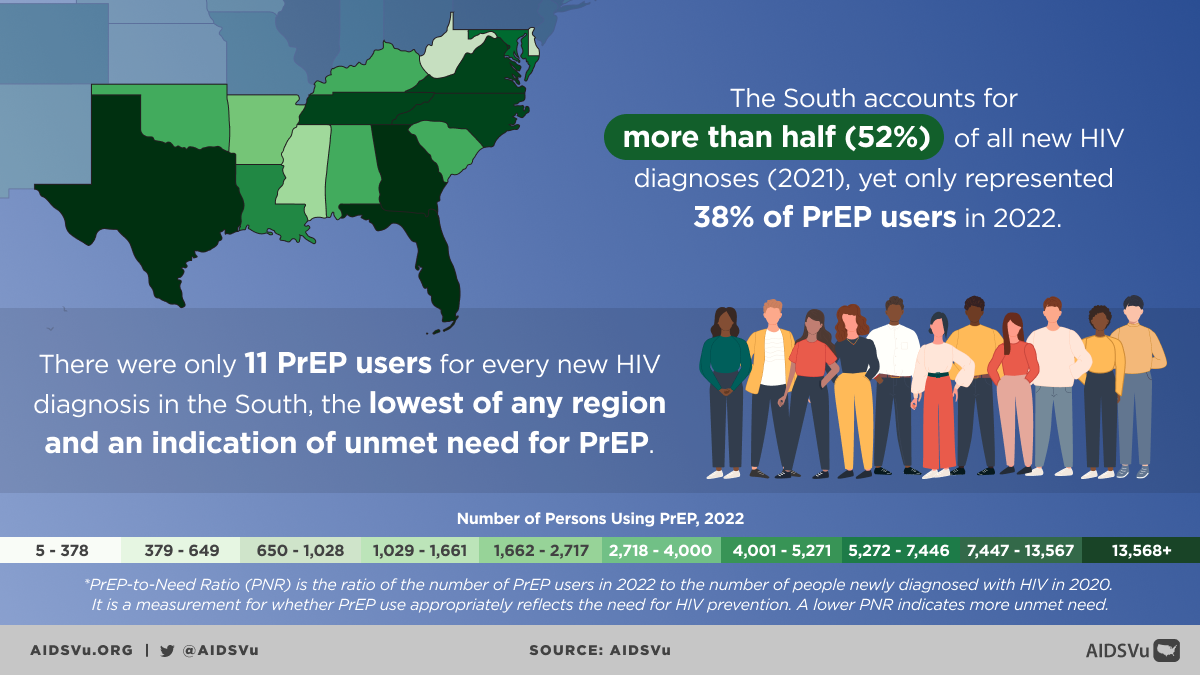
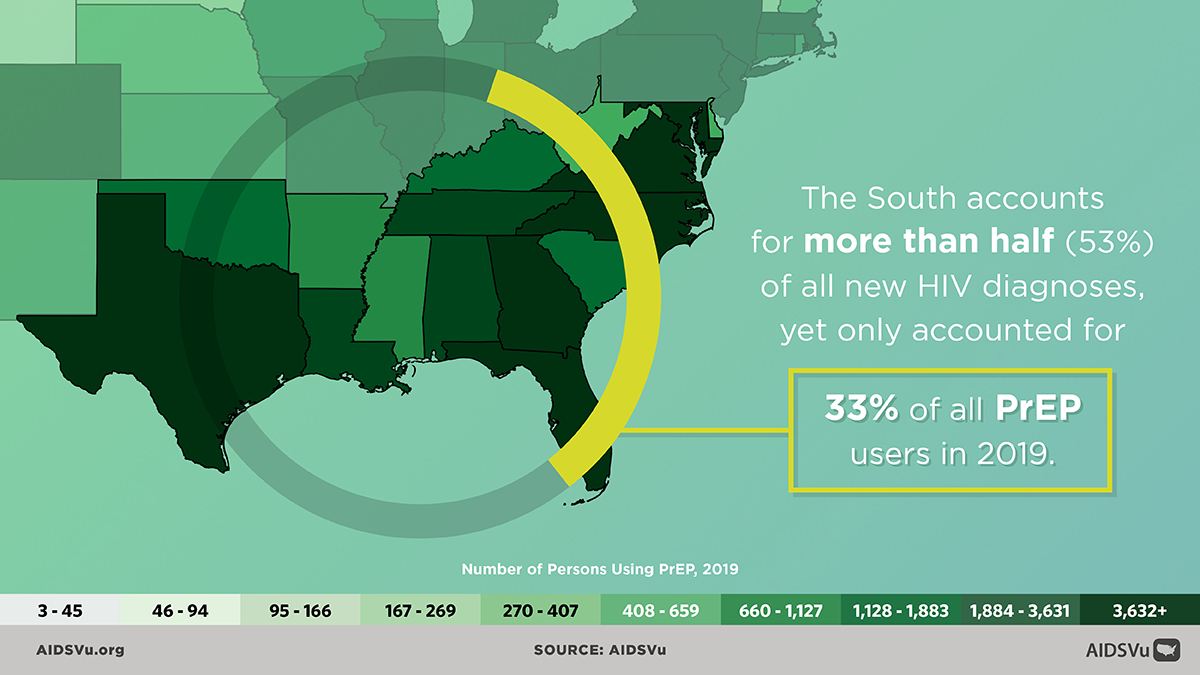
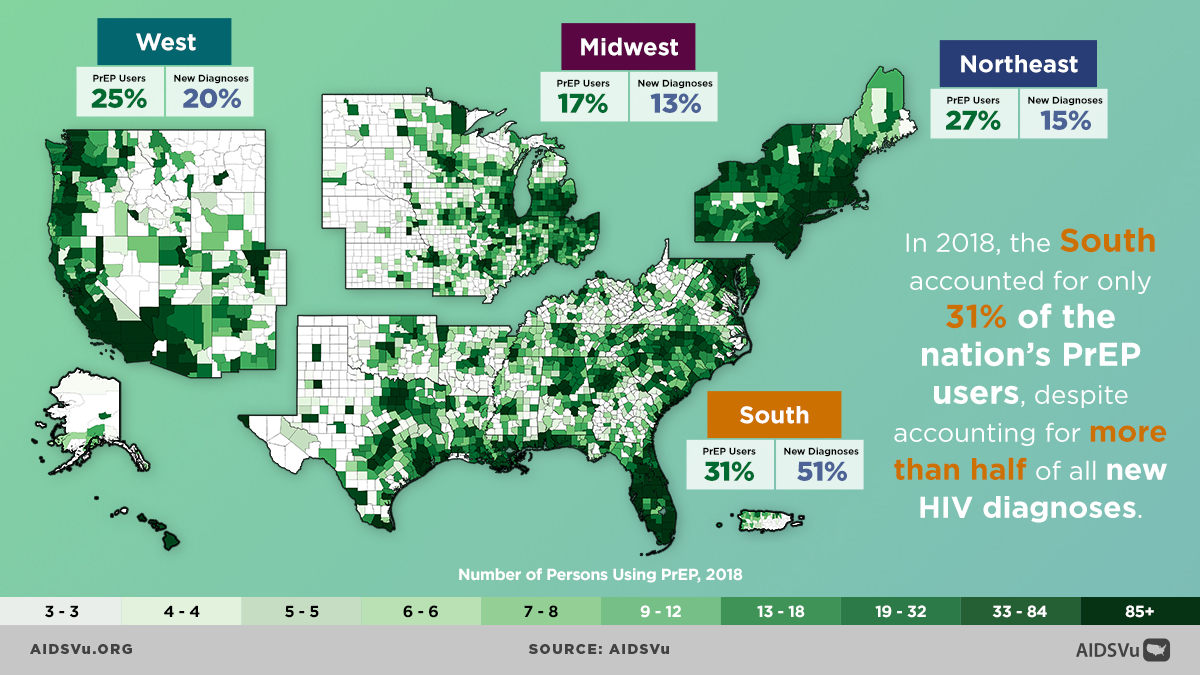
- The South had the greatest unmet need for PrEP of all U.S. regions.
- While 39% of PrEP users were in the South in 2025, the region accounted for 52% of new HIV diagnoses in 2024 and had the lowest PrEP-to-Need Ratio of all regions.
- The Northeast had the highest PrEP-to-Need Ratio, while the South had the lowest.
- The Midwest had the lowest PrEP use rate of all U.S. regions.
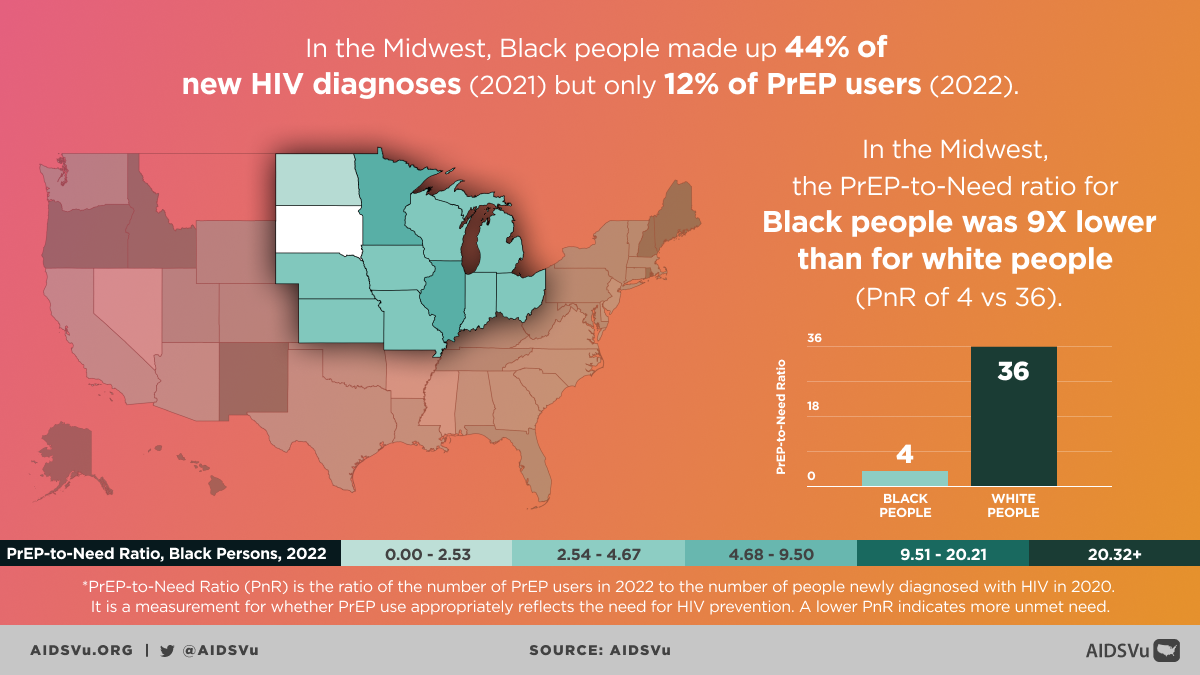
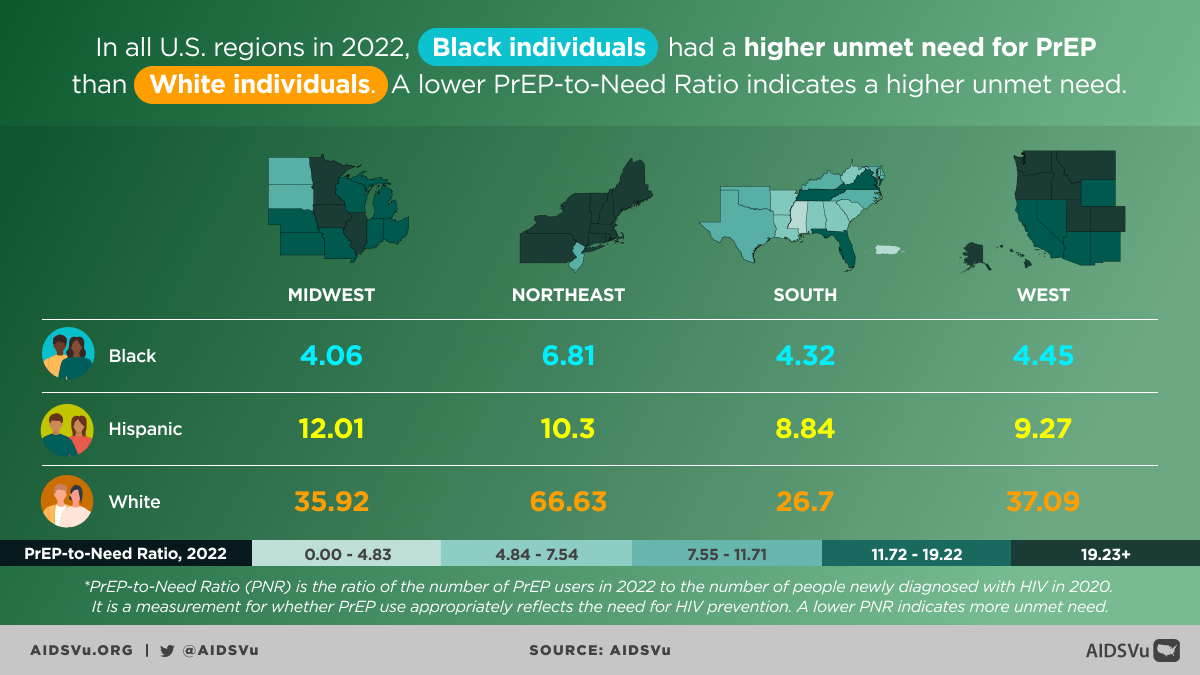
- Across all regions, PnR was highest for white people and lowest for Black people. In 2025, the lowest region- and race-specific PnR was among Black people in the West, while the highest was among white people in the Northeast.
PrEP Use by Region and Race/Ethnicity
- In 2024, Black people represented 41% of new HIV diagnoses in the Midwest but only accounted for 13% of PrEP users in the region in 2025.
- In 2024, Black people represented 40% of new HIV diagnoses in the Northeast but only accounted for 13% of PrEP users in the region in 2025.
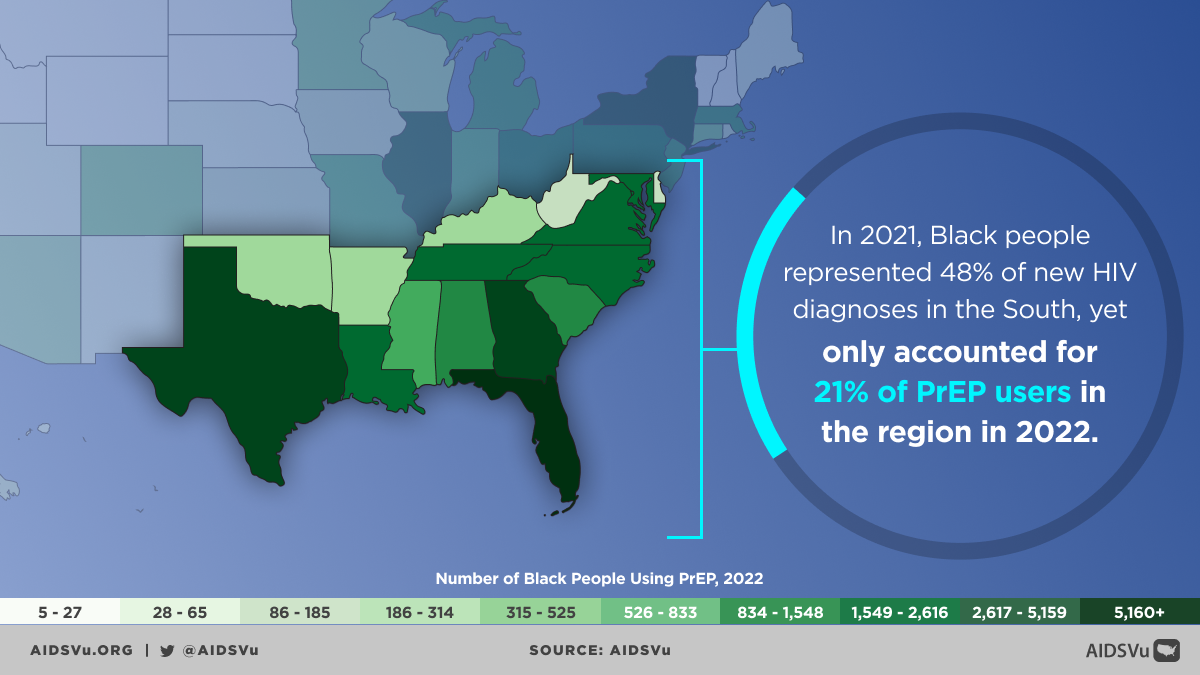
- In 2024, Black people represented 48% of new HIV diagnoses in the South but only accounted for 23% of PrEP users in the region in 2025.
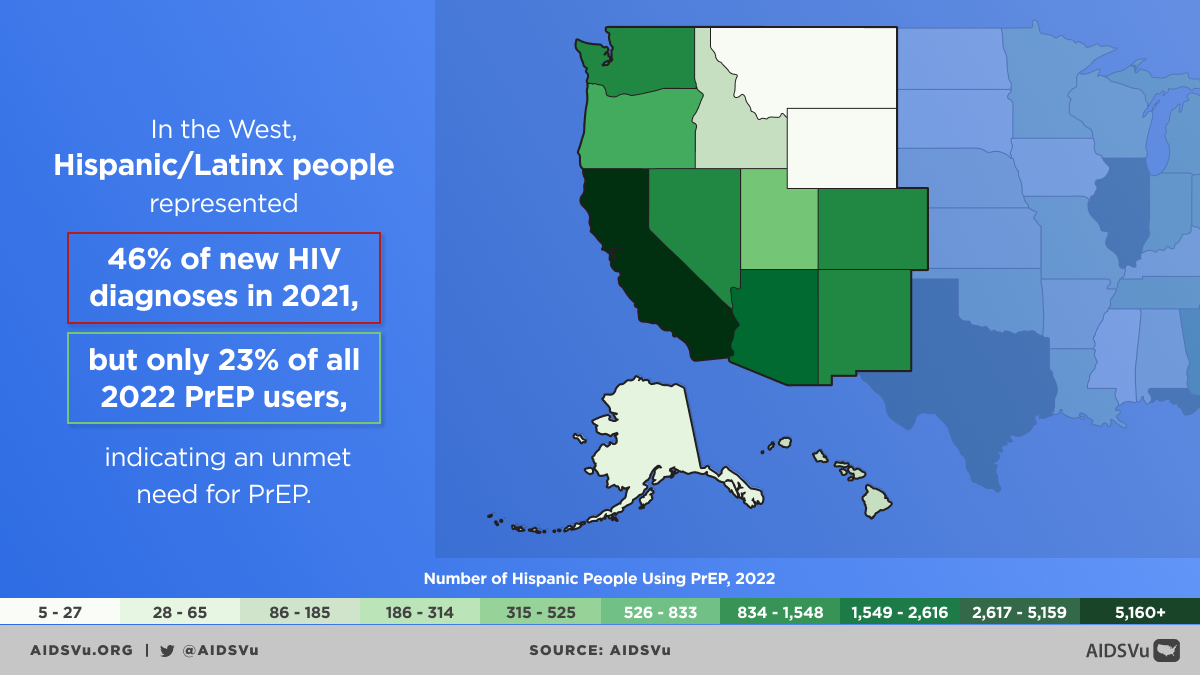
- In 2024, Hispanic people represented 51% of new HIV diagnoses in the West but only accounted for 25% of PrEP users in the region in 2025.
PrEP Use and Medicaid Expansion
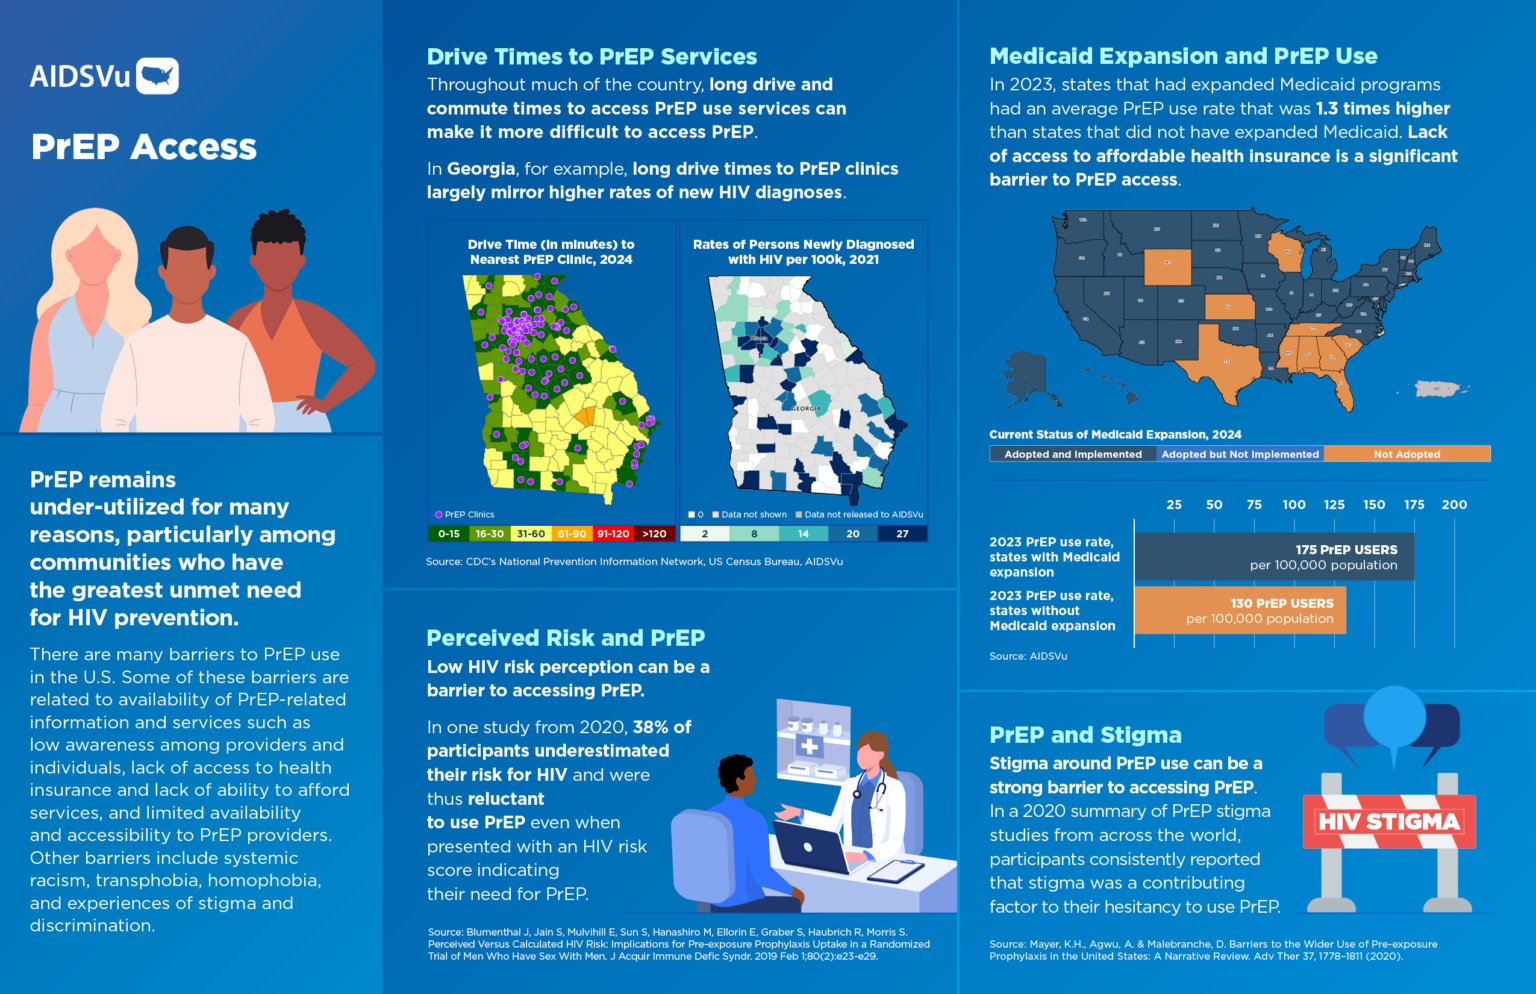
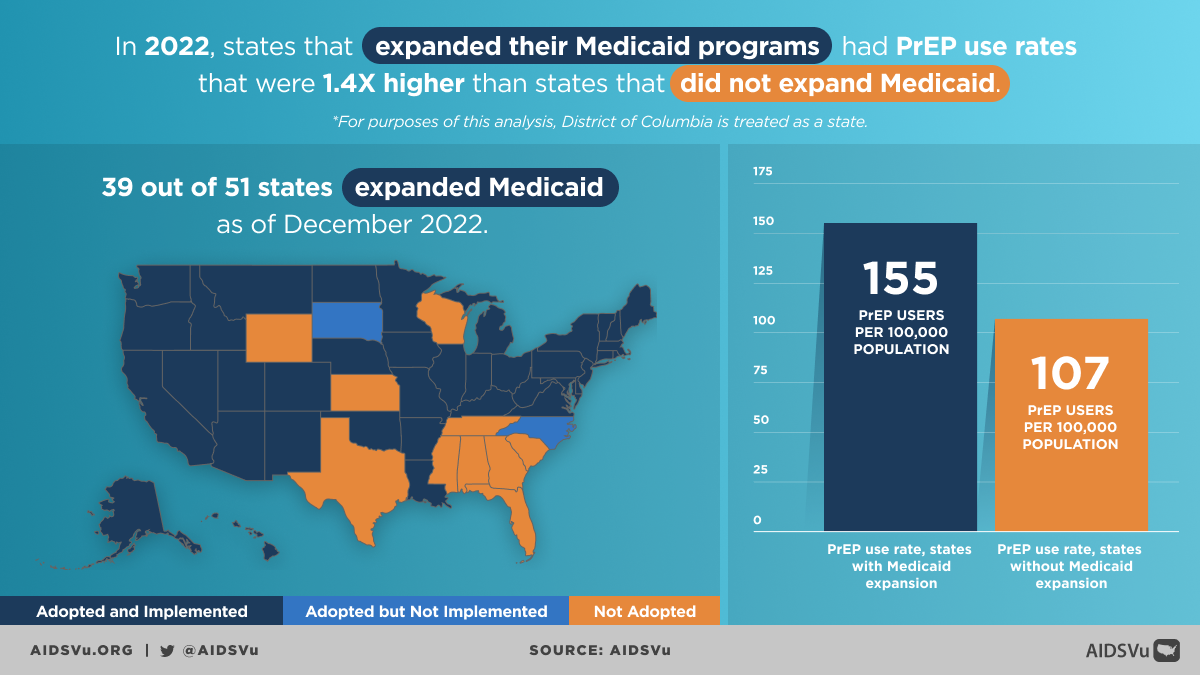
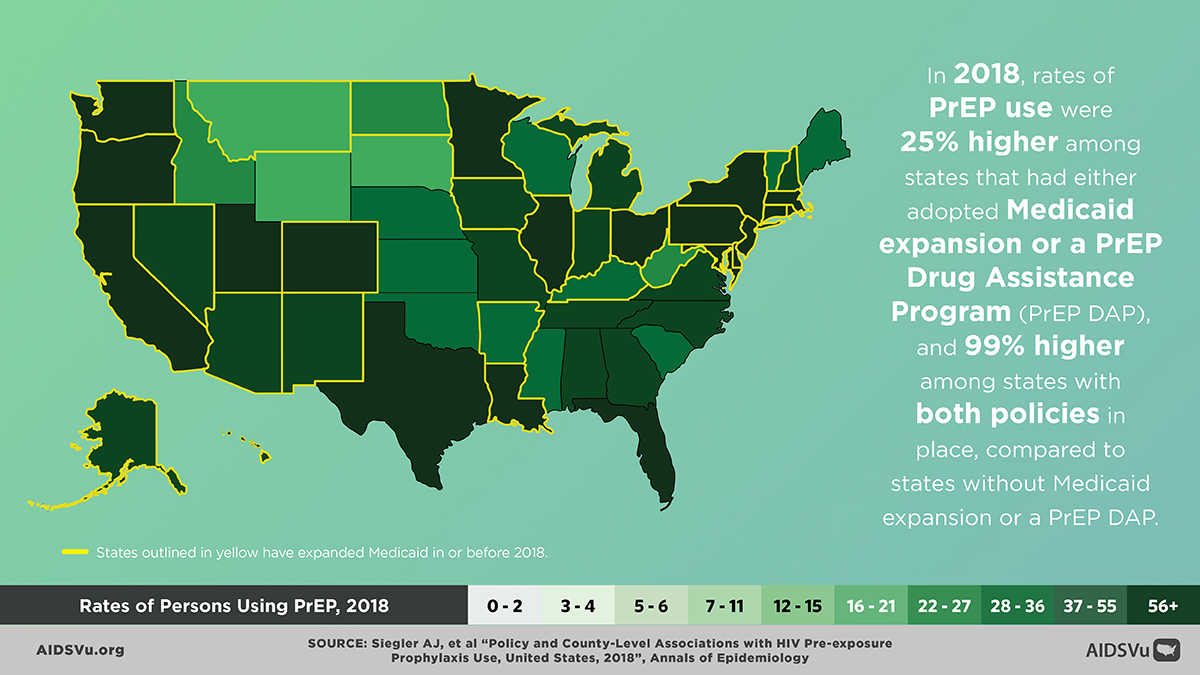
- In 2025, states that had expanded Medicaid had an average PrEP use rate that was 1.3 times higher compared with states that had not expanded Medicaid.
- In 2025, states that had expanded Medicaid had an average PrEP-to-Need Ratio that was more than twice as high compared with states that had not expanded Medicaid.
- Note: 41 of the 50 U.S. states and D.C. had adopted and implemented Medicaid expansion as of May 2025. Puerto Rico is not included in this analysis.
EHE Counties and PrEP Use
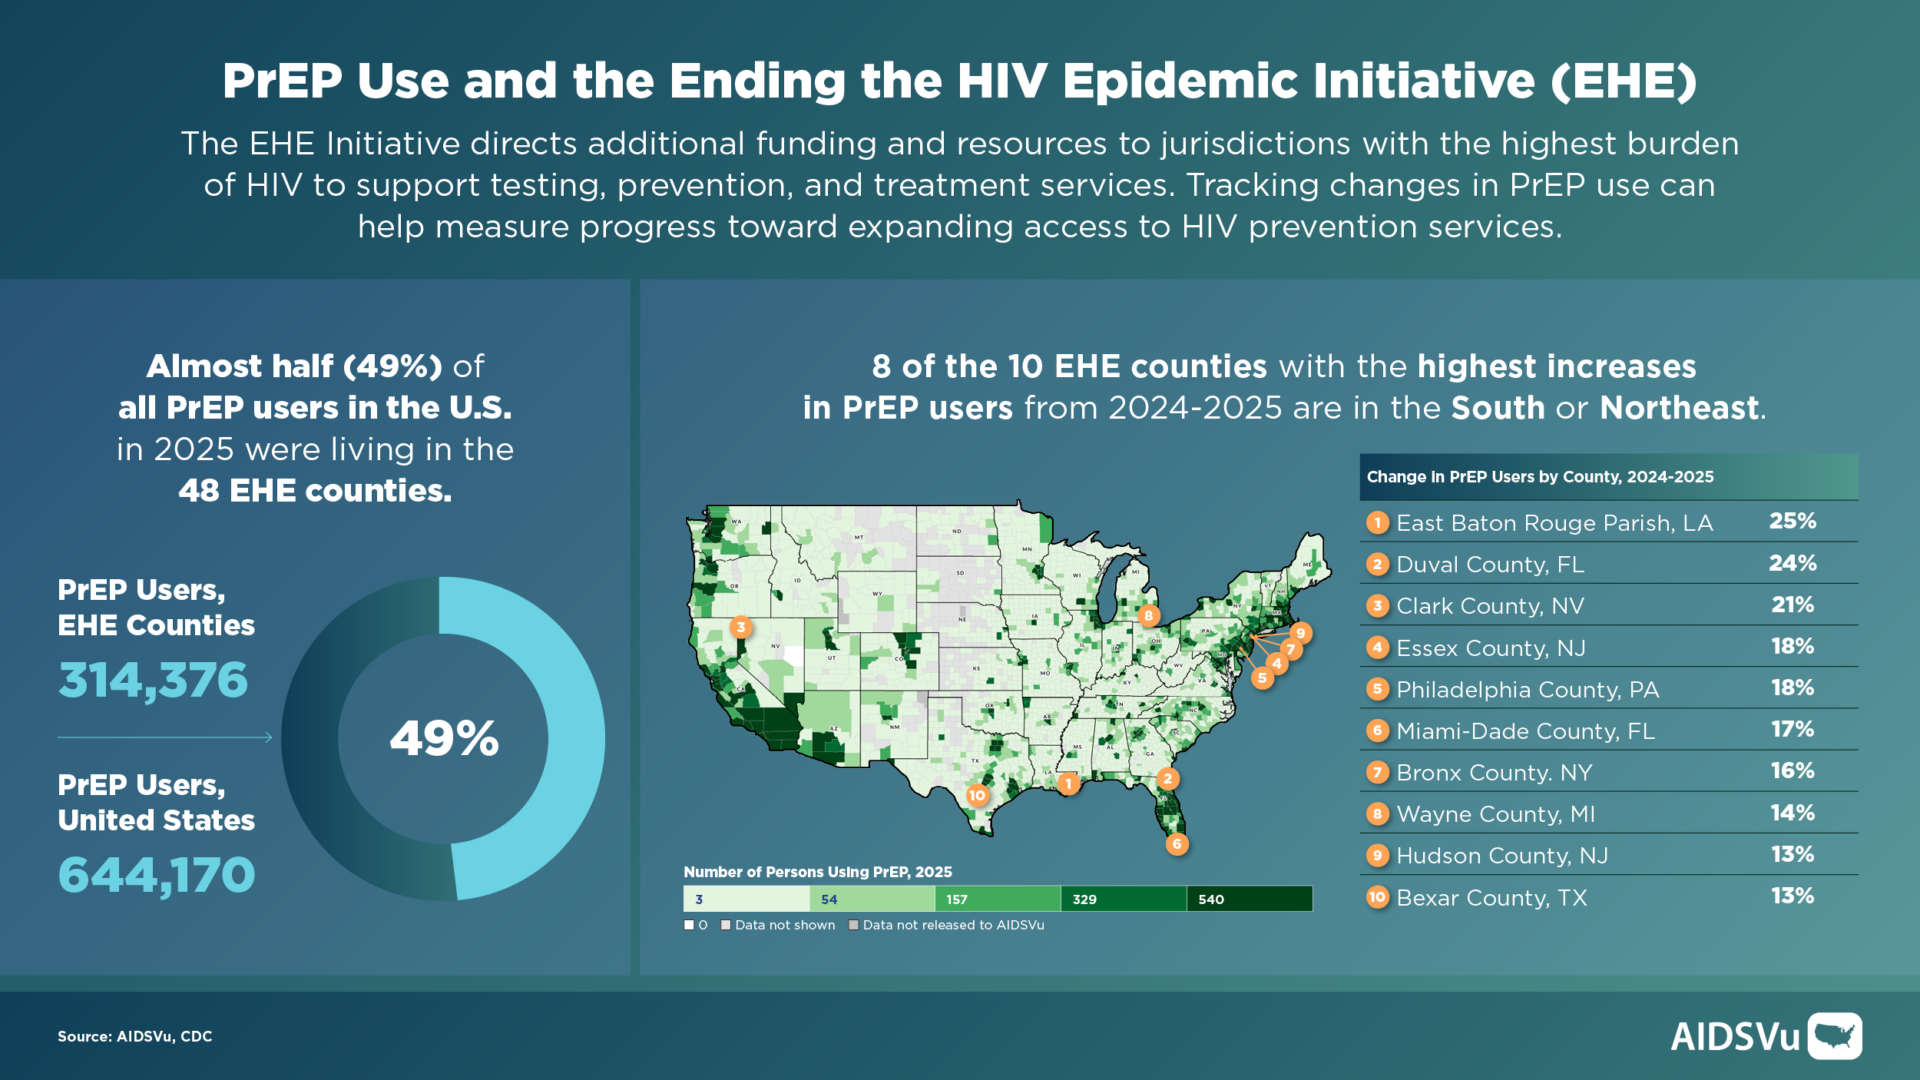
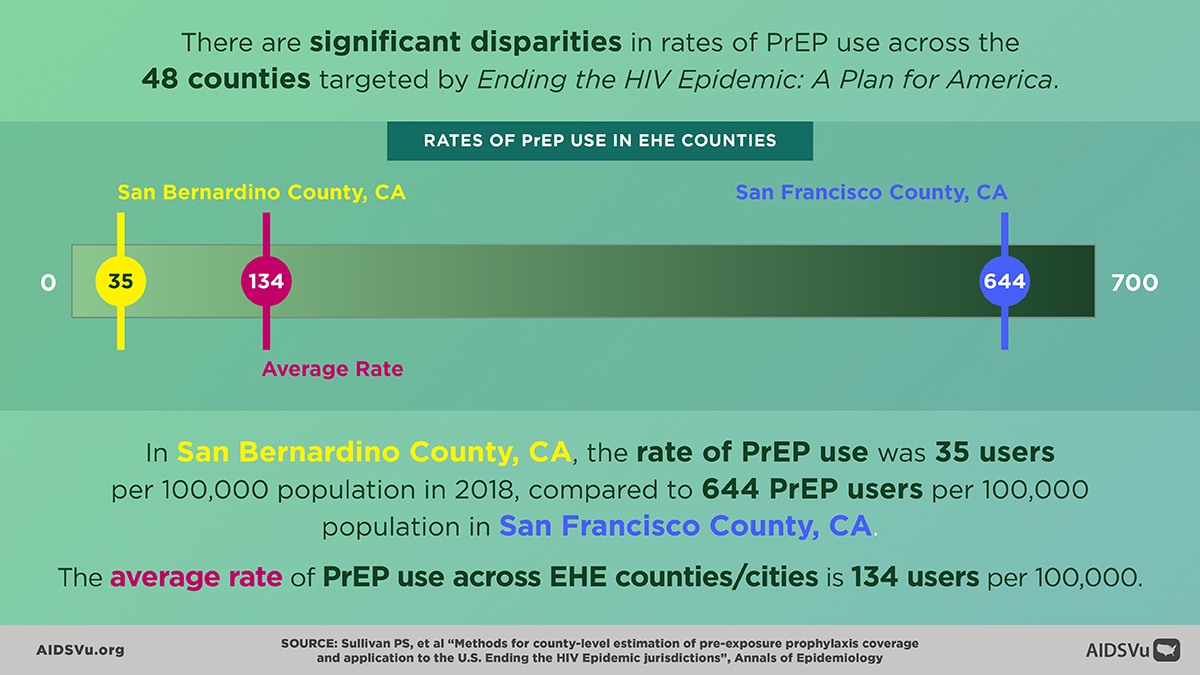
- Almost half of all PrEP users in the U.S. in 2025 lived in the 48 Ending the HIV Epidemic, or EHE, counties.
- Between 2019 and 2025, the number of PrEP users in EHE counties increased from 139,138 to 314,376.
- Eight of the 10 EHE counties with the highest increases in PrEP users and PrEP-to-Need Ratio from 2024 to 2025 were in the South or Northeast.
- At the same time, seven of the 10 EHE counties with the highest new diagnosis rates in 2024 were in the South.
- These data show the importance of expanding PrEP awareness, access, and uptake in areas where new HIV diagnosis rates remain high and unmet need for PrEP is greatest.
PrEP Access and Drive Times
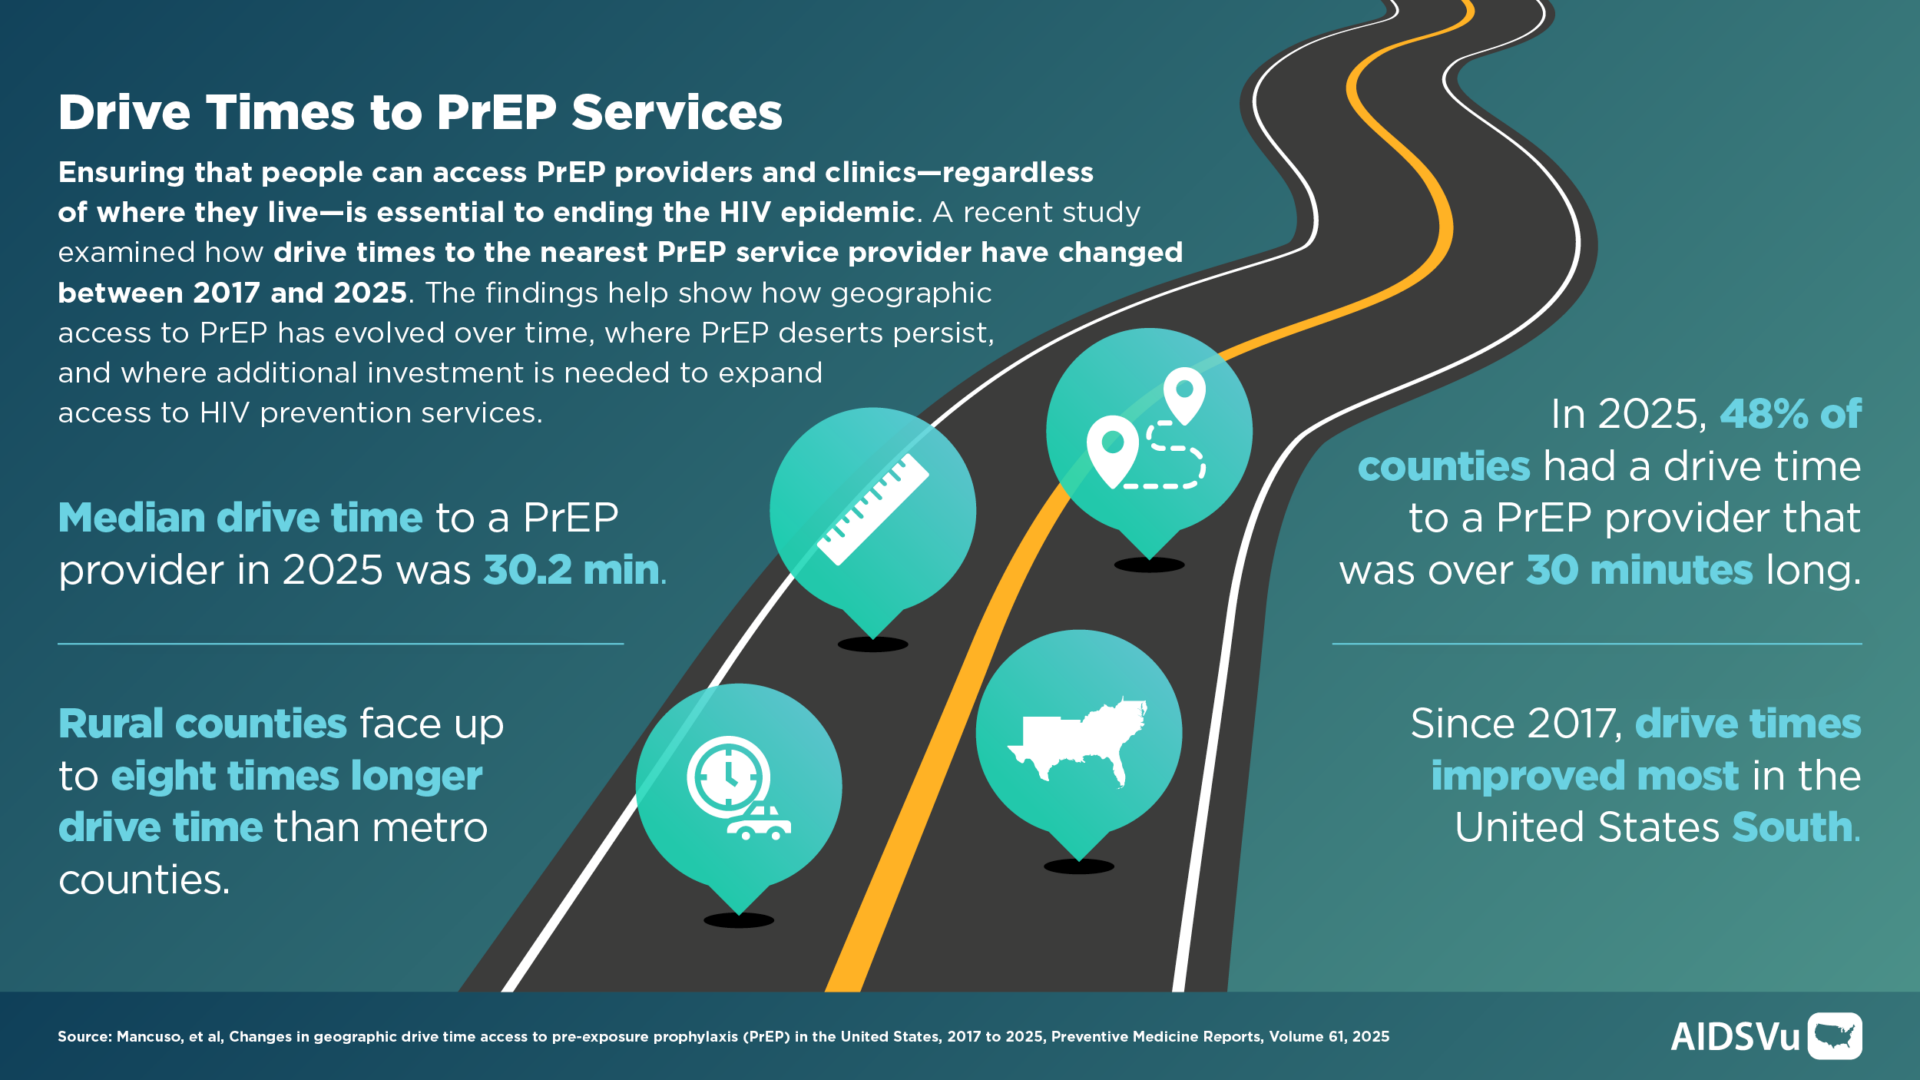
- In 2025, the median drive time to a PrEP provider was 30.2 minutes.
- Nearly half of counties had a drive time of more than 30 minutes to a PrEP provider in 2025.
- Since 2017, drive times improved most in the South.
- Rural counties continue to face significant access barriers, with drive times up to eight times longer than metro counties.
PrEP Services
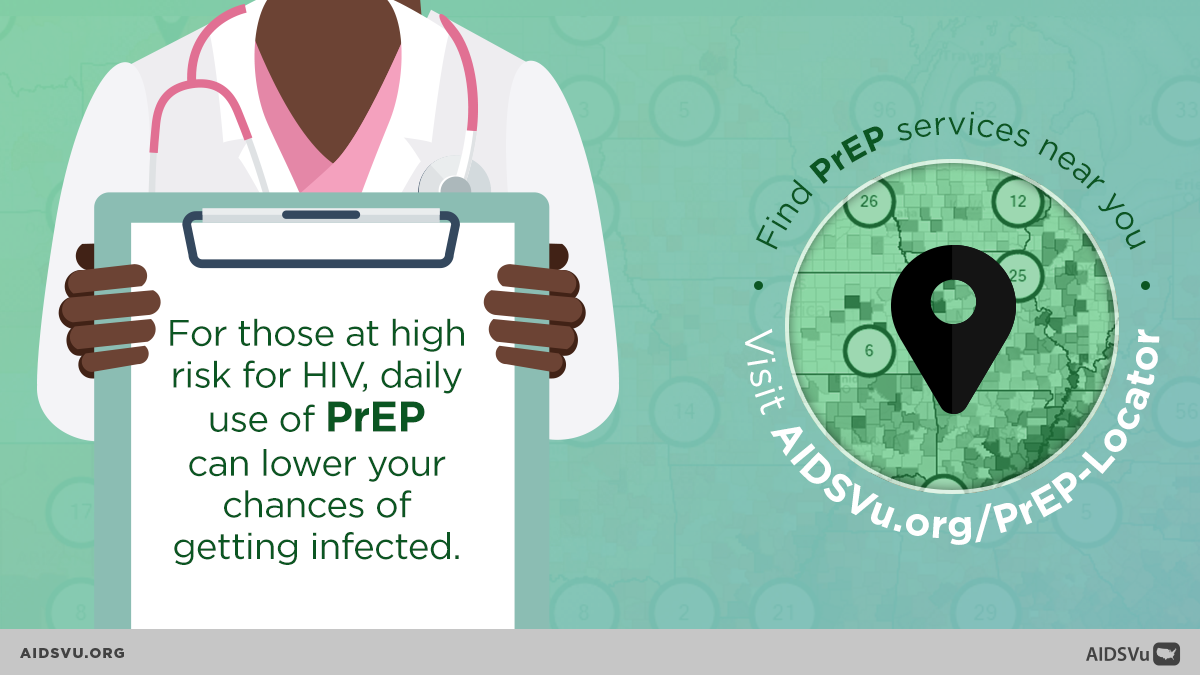
Use AIDSVu’s PrEP Locator, a national directory of providers of PrEP in the U.S., to find PrEP services near you.
Find Locations
PrEP Maps
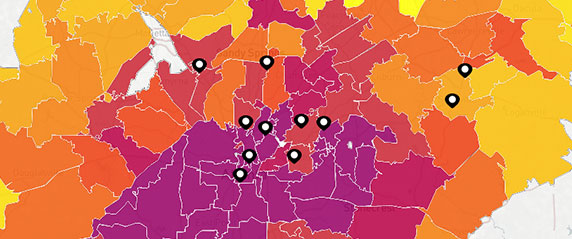
Explore AIDSVu’s PrEP maps to see state- and county-level PrEP utilization from 2012 to 2022 and other HIV data such as new diagnoses, prevalence, and mortality.
See the Data
Beyond the Map
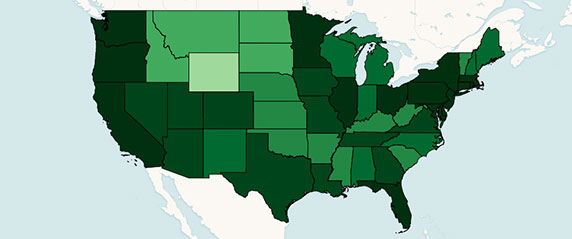
AIDSVu offers tools and resources beyond the HIV map that provide users with a deeper understanding of the HIV epidemic, its socioeconomic driving factors, and services available at the community level.
Find Services
Use the testing, Pre-Exposure Prophylaxis (PrEP), and care services locators to find critical HIV/AIDS services near you.
Learn MoreLocal Data
View city and state profiles with local HIV/AIDS statistics, national comparison charts, and local resources.
Learn MoreFor More Information
Learn more about PrEP with the following resources.