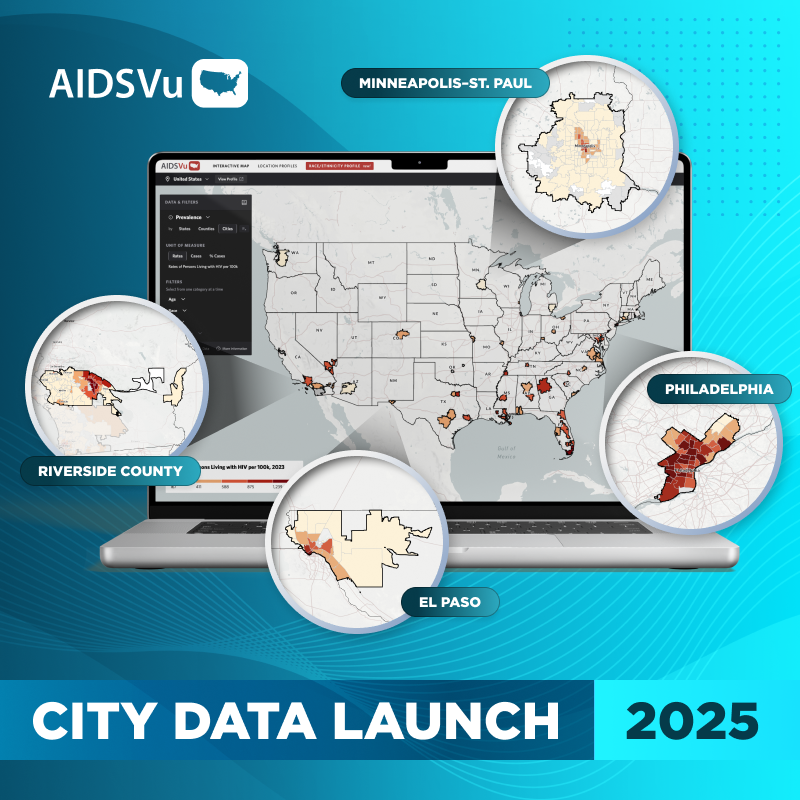
In this era of Big Data, new innovative tools are emerging that allow for the analysis and visualization of critical health issues. AIDSVu is one of those tools. The site helps users understand HIV/AIDS by using data to illustrate the impact in the United States. By mapping the disease, we can see where the epidemic is most concentrated and what areas are most impacted by HIV, down to the ZIP code and in some cases, census tract and neighborhood levels.
Health departments, academic institutions, and community-based organizations are using the AIDSVu interactive maps to identify prevention and care resource gaps and determine potential drivers of the epidemic in particular communities. Below are several examples of how researchers are using AIDSVu to address the local HIV epidemic:
- Recently, the South Carolina Rural Health Research Center used AIDSVu to map HIV prevalence rates by rurality – a measure of whether a region is urban or rural. Their findings highlight areas of the U.S. that are largely rural with an above-median level of HIV prevalence and note the challenges of care in these same areas.
- Medical AIDS Outreach of Alabama used AIDSVu maps to understand HIV rates in the state by county and determine where treatment needs are most urgent. By overlaying AIDSVu maps with CDC maps of Health Professional Shortage Areas, MAO has been able to target resources where they will have the most impact.
- The University of California, Los Angeles’s new Center for Digital Behavior used AIDSVu data and publicly-available, geo-tagged tweets to establish whether a larger number of tweets indicating risk behaviors in an area could be correlated with higher rates of HIV.
These are just a few ways in which AIDSVu maps can be used to help fight the U.S. HIV epidemic. We encourage you to explore the AIDSVu resources, including map reproductions, presentations, and data. Below are just some of the resources available on AIDSVu:
- The interactive maps on AIDSVu visualize the U.S. HIV epidemic across geographic levels and can help people understand risk within their community. Maps are available at the state, county, ZIP code, and in some cases, census tract and neighborhood level, and can be viewed alongside social determinants of health, such as poverty, income, education, and health insurance status.
- Downloadable slide decks at the national, state or city level are available for use in presentations, proposals and reports, conference materials.
- AIDSVu’s HIV testing and care services locators can be used to refer individuals to the nearest facilities for testing and treatment. Testing and care services location pins can also be overlaid on AIDSVu’s interactive maps to better understand where resources are located in relation to where people with HIV are living.
- AIDSVu infographics can be shared on social media to help raise awareness.
To learn more about which of AIDSVu’s resources are best suited for your needs, visit Maximizing AIDSVu for Your Needs. If you have used AIDSVu in your work, please send us an email to let us know.


