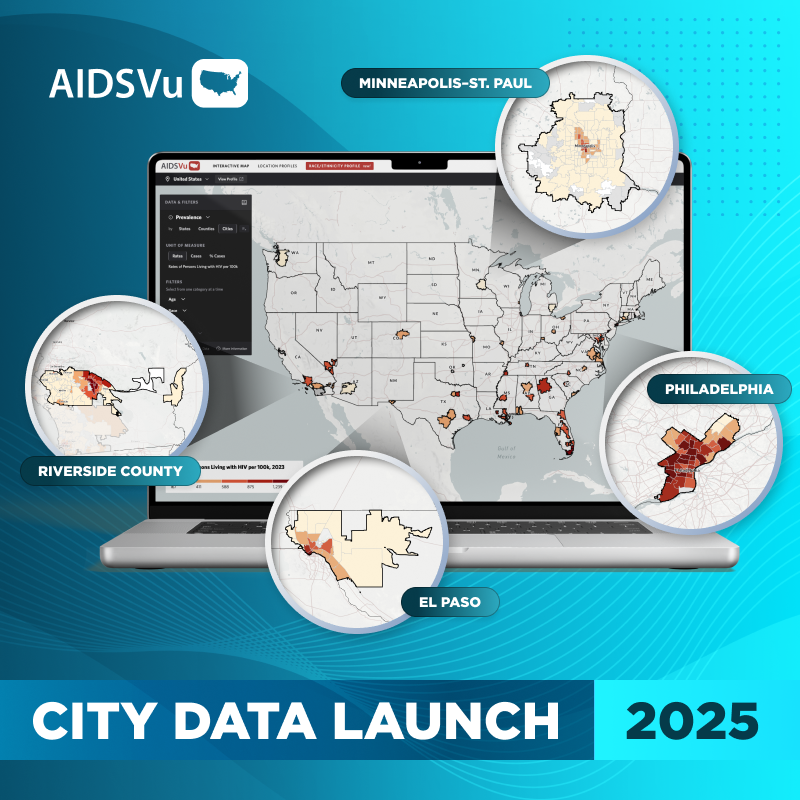
Today, AIDSVu announced its annual launch of new, interactive online maps visualizing the impact of HIV in the U.S., and highlighting continued disparities – both geographically and among different groups, particularly among youth and African Americans. As we observe the 35th anniversary of the first HIV/AIDS diagnosis in the United States, the new AIDSVu maps continue to illustrate that there is still work to be done to reach a shared goal of zero new HIV infections.
Using the most recent publicly available data, AIDSVu’s new maps illustrate changes in the HIV epidemic, including:
- Southern States Experiencing Greatest Burden of Infection and Deaths: The Southern U.S. is home to nearly 37 percent of the country’s population, but these states account for half of all new HIV diagnoses (50 percent) and deaths among persons diagnosed with HIV (47 percent). In 2014, eight of the ten states with the highest rates of new HIV diagnoses (Washington, D.C., Louisiana, Florida, Maryland, Georgia, Texas, Mississippi, South Carolina) and the top five cities with the highest rates of new HIV diagnoses were in the South (Miami, FL; Baton Rouge, LA; Fort Lauderdale, FL; New Orleans, LA; and Jackson, MS).
- HIV Diagnoses Among Youth Rising: In 2014, young persons between ages 13 and 24 accounted for almost one quarter (22 percent) of all new HIV diagnoses. While the number of new HIV diagnoses among all persons in the U.S. decreased by 11 percent between 2008 and 2014, new HIV diagnoses among youth increased by nearly 11 percent. In that same time period, new HIV diagnoses among young men who have sex with men, aged 13 to 24, increased by nearly 30 percent (27 percent), and in 2014, accounted for 18 percent of all new HIV diagnoses.
- African Americans Are Most Impacted: While making up just 12 percent of the U.S. population, black or African American persons accounted for 44 percent of all new HIV diagnoses in 2014. The impact is particularly apparent in the South where black or African American persons make up more than half (54 percent) of this region’s new HIV diagnoses in 2014. In 2013, nearly half (46 percent) of all deaths that occurred among people diagnosed with HIV were black or African American persons, compared to white persons (30 percent), and Hispanic/Latino persons (19 percent).
- Late HIV Diagnoses Show Continued Need for Testing: Of the estimated 1.2 million people living with HIV, one in eight do not know they are infected. In 2013, nearly one quarter of all persons newly diagnosed with HIV were considered late diagnoses, meaning individuals were diagnosed after the disease had already progressed to AIDS. These statistics emphasize the need for increased testing and highlight the importance of aligning resources to the areas that need it most.
AIDSVu is continuing to expand its maps and resources to provide the most comprehensive understanding of HIV at the national, state, and local levels. This year, AIDSVu is adding six new cities – Austin, TX; Baltimore, MD; Hartford, CT; Las Vegas, NV; Nashville, TN; and Raleigh, NC – bringing the total to 40 U.S. cities mapped. Together these cities represent more than 60 percent of the U.S. HIV epidemic.
Other highlights of the launch:
- Enhanced City Profile pages for 36 U.S. cities, updated to include new HIV diagnoses data.
- Updated state- and county-level data showing HIV prevalence (2013), and new HIV diagnoses (year-over-year for 2008 to 2014).
- Multi-way data stratification at the state level, giving users a more detailed view of the epidemic by allowing them to select up to two demographic filters at the same time (e.g., age, race, sex, transmission category).
- Mortality data (2013) at the state level, showing rates and number of deaths that occurred among people with diagnosed HIV.
AIDSVu’s new maps and resources can help people working in HIV to gain a deeper understanding of where prevention, testing, and care services are needed. For a look at how other organizations have used AIDSVu maps and data, or to share your own story, visit How Do You AIDSVu. AIDSVu’s maps, data sets, and other materials are available for use in the Resources section of the site.


