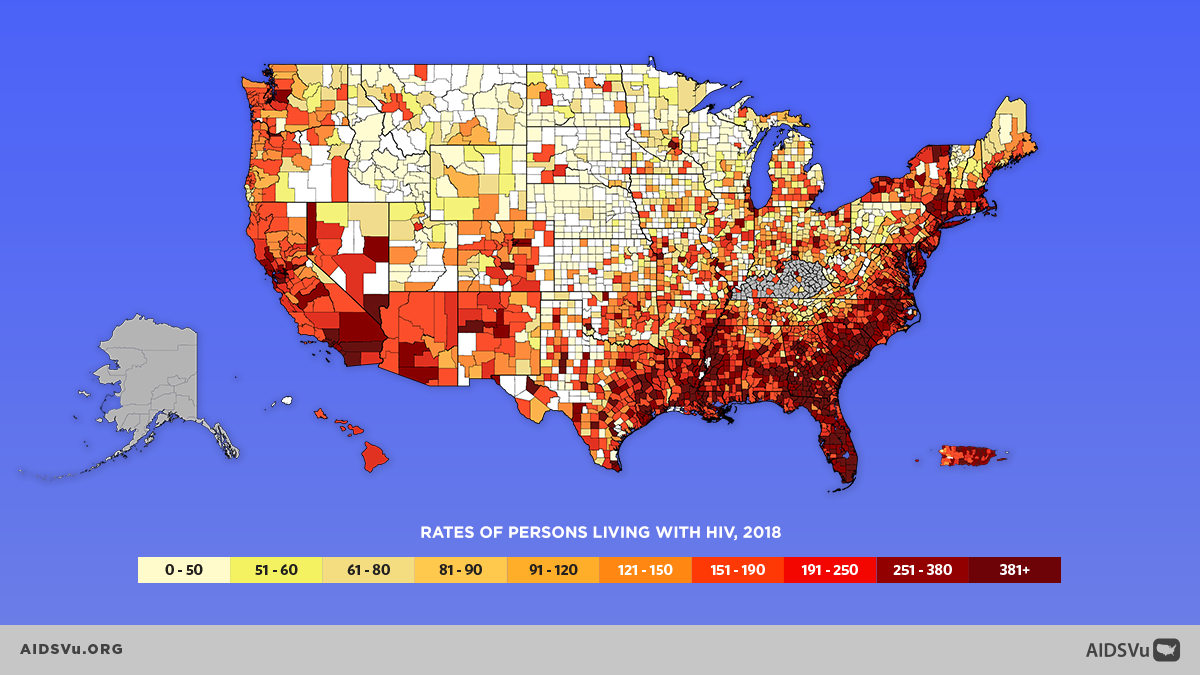
Today marks the annual update for AIDSVu’s interactive maps, illustrating the impact of HIV across the U.S. and continuing AIDSVu’s commitment to providing the most comprehensive view of the national HIV epidemic. Using the latest available Centers for Disease Control and Prevention (CDC) data at the county- and state-levels, AIDSVu’s maps now visualize 2018 HIV prevalence and 2018 new HIV diagnoses data alongside mortality and PrEP use, both geographically and across different demographic groups.
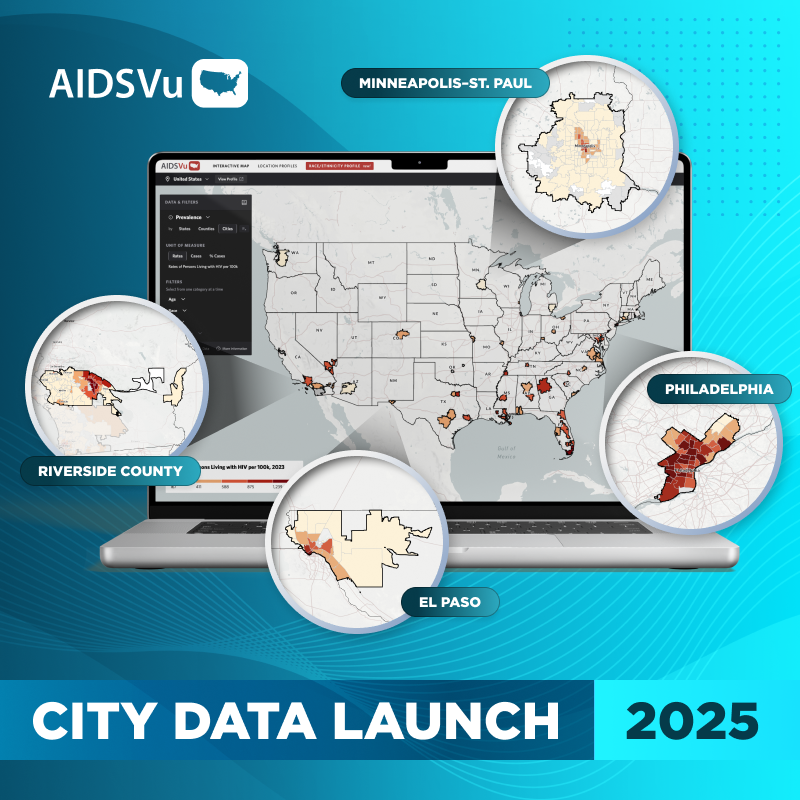
Last month, AIDSVu also released updated ZIP Code-level maps for almost 50 cities across the U.S. and added HIV care continuum data for more than 35 of those cities, further illustrating how the HIV epidemic impacts cities and neighborhoods at a fine geographic level to enable targeted and effective policy and programmatic interventions.
As AIDSVu marks its tenth anniversary this year, it remains committed to its mission of making data widely available, easily accessible, and locally relevant to inform public health decision-making. From national data from CDC, to the first ever county-level data on PrEP use released earlier this year, to city-level HIV care continuum data, AIDSVu continuously strives to present more granular data and 2020 and beyond is no different.

Major data updates for 2020 include:
- State- and county-level data showing HIV prevalence (2018) and new HIV diagnoses (year-over-year from 2008 to 2018).
- Mortality data at the state level, showing rates and number of deaths that occurred among people with diagnosed HIV (2018).
- County-level PrEP rates and users data (2018), which can be stratified by age and sex.
- ZIP Code-level data showing HIV prevalence (2018) and new HIV diagnoses (2014-2018 five year cumulative) for over 45 U.S. cities.
- Comparison maps of social determinants of health – such as poverty (2018), high school education (2018), median household income (2018), income inequality (2018), and people without health insurance (2018).
- Enhanced national, regional, state, county, and city data profiles, including PrEP and HIV care continuum data, that are easy to download and print.
About AIDSVu’s Annual Data Update
AIDSVu is presented by Emory University’s Rollins School of Public Health in partnership with Gilead Sciences, Inc. and the Center for AIDS Research at Emory University (CFAR). Now in its tenth year, AIDSVu continues to advance its mission to make HIV data widely available, easily accessible, and locally relevant to inform public health decision making. The site aims to provide researchers, policymakers, and community members with a more comprehensive understanding of the HIV epidemic at the local-, state-, and national-level.
State- and county-level data displayed on AIDSVu were obtained from the CDC and compiled by researchers at the Rollins School of Public Health. PrEP use data were obtained from Symphony Health’s national, patient-level prescription data source that represents more than 54,000 pharmacies, 1,500 hospitals, 800 outpatient facilities, and 80,000 physician practices across the U.S. The PrEP data on AIDSVu represent a reliable and consistent estimate of the number of PrEP users at the county- and state-level in the U.S. by year. The actual number of PrEP users is likely higher. ZIP Code, census tract, and community area/ward data were provided by state and city health departments and compiled by researchers at the Rollins School of Public Health. To learn more about AIDSVu’s data and sources, see our FAQ and Data Methods.


