The PrEP data on AIDSVu reveal important disparities in use across many dimensions, including sex, age, geographic location, socioeconomic status, and access to PrEP care.
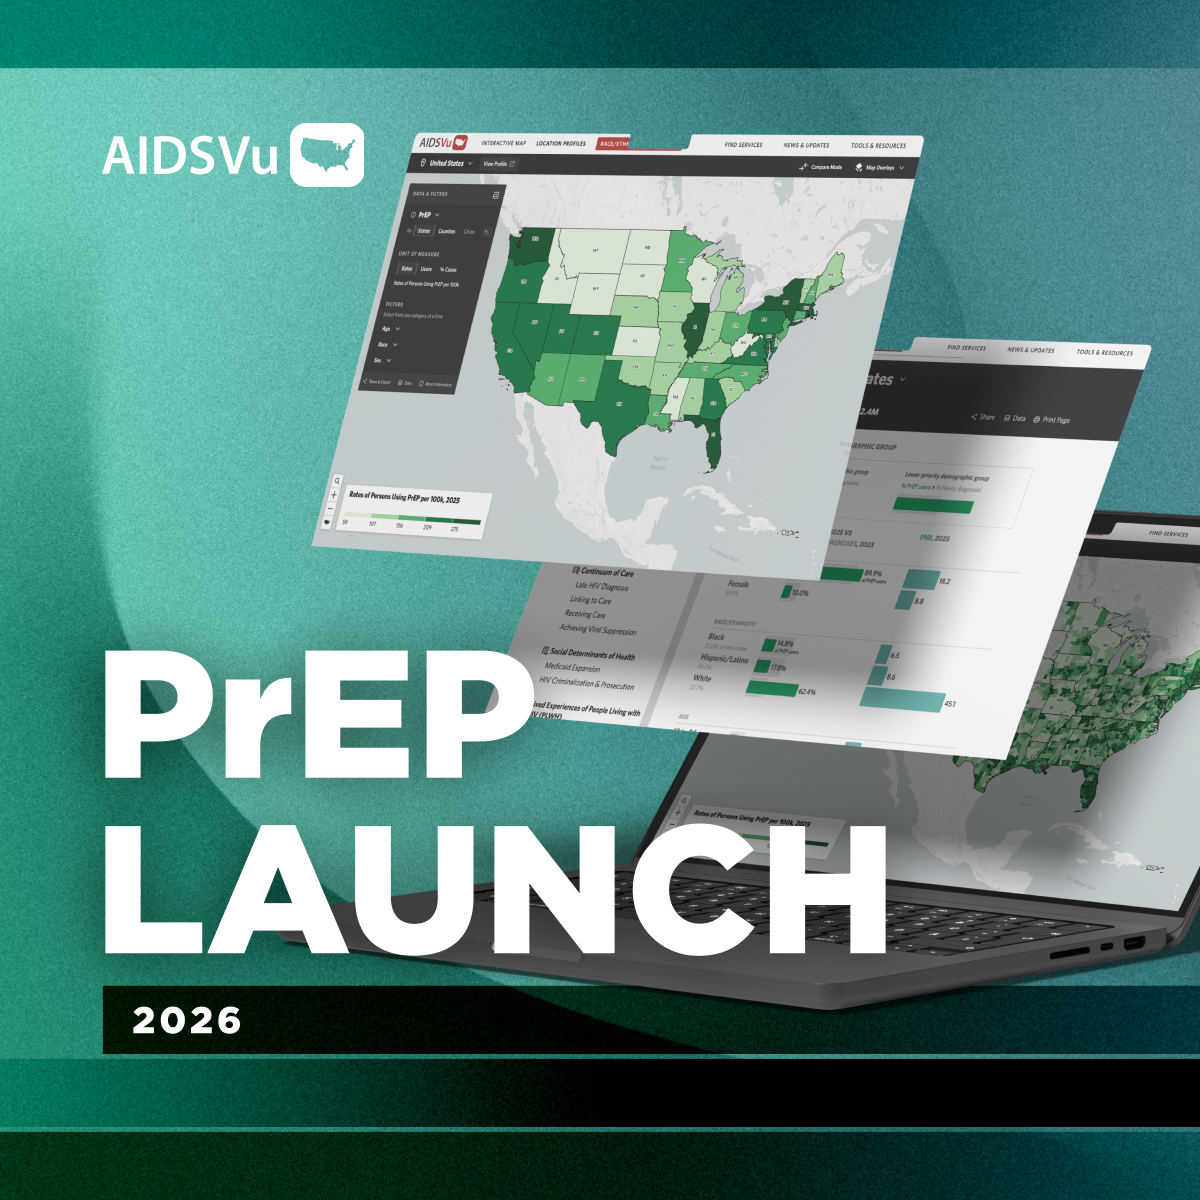
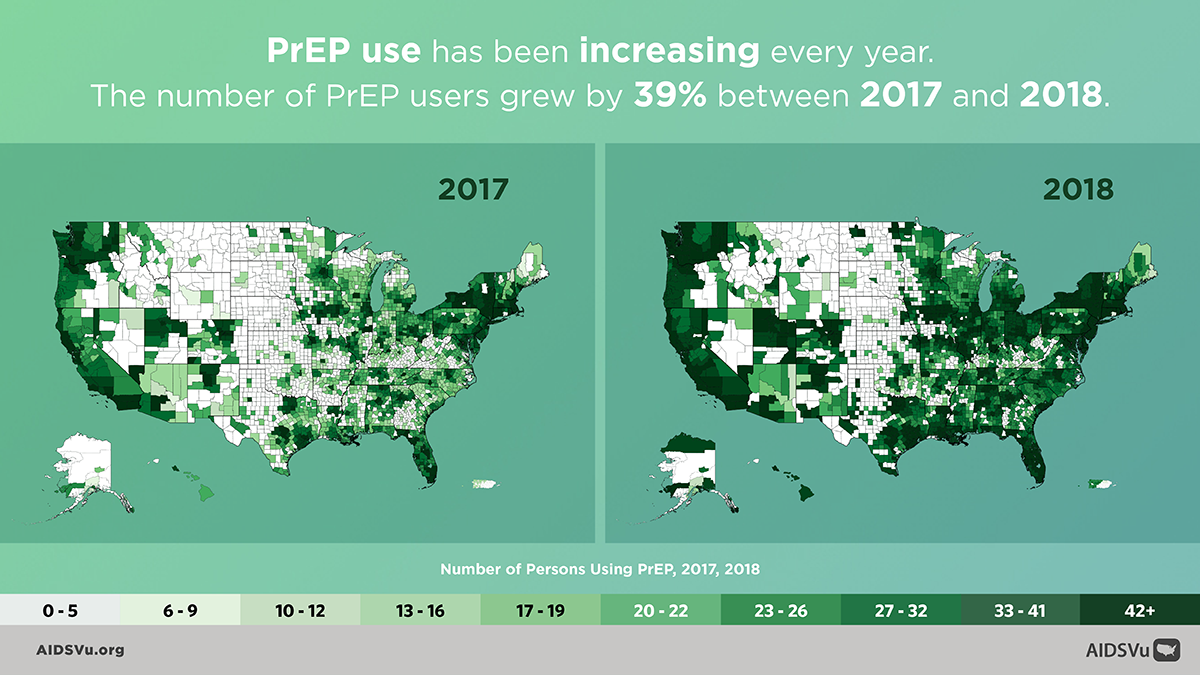
AIDSVu has released interactive county-level data and maps visualizing PrEP use from 2012 to 2018, providing a more granular view of PrEP use across the U.S.
PrEP, or pre-exposure prophylaxis, is when people at risk for HIV take medicine daily to lower their chances of getting infected with HIV. The Centers for Disease Control and Prevention (CDC) has estimated that approximately 1.1 million people are at high-risk for HIV exposure and could benefit from comprehensive HIV prevention strategies, including PrEP.
In conjunction with the launch of AIDSVu’s PrEP data and maps, two studies were conducted and published in Annals of Epidemiology, presenting key insights from the county-level data, which are detailed below.
PrEP on AIDSVu
For more information on PrEP, AIDSVu provides a number of resources.
- The Deeper Look: PrEP page provides further insight on how to utilize the PrEP and PnR data, and features insights from the data, downloadable infographics, and blogs by HIV experts.
- The PrEP Locator, is a national directory of public and private practice providers of PrEP across the U.S. AIDSVu users can find local PrEP providers near them with this tool or overlay service locations on top of AIDSVu’s PrEP use maps.
The PrEP data on AIDSVu provide a reliable and consistent metric for PrEP users at the county- and state-level and are well suited to be used for public health research and planning purposes. Because there is no national registry of all PrEP users, the AIDSVu data represent an underestimate of total PrEP users in a given jurisdiction; the actual number of PrEP users is likely higher. These data can be used to:
- Monitor progress, trends, and disparities in PrEP use at the county- and state-level and among specific age groups or by sex;
- Compare PrEP use among counties, states, and regions;
- Support research to investigate questions related to PrEP awareness, access, and use; and
- Inform public health planning.
For more information on the data source and limitations, see our Data Methods and FAQs.
Key Insights from the Data
According to a study led by Aaron Siegler, PhD and published in Annals of Epidemiology, PrEP use varied greatly across the U.S.
State-level Insights
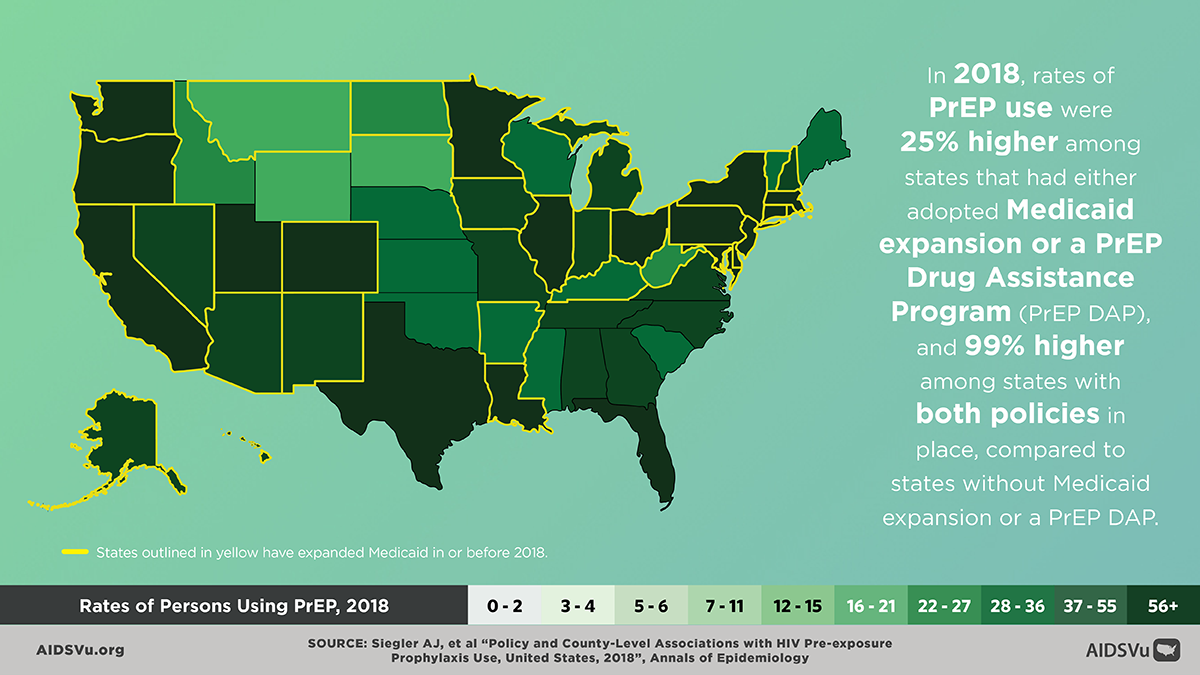
States with either Medicaid expansion or a Pre-Exposure Prophylaxis Drug Assistance Program (PrEP-DAP) had a 25% higher rate of PrEP use in 2018 and states with both Medicaid expansion and a PrEP-DAP had a 99% higher rate of PrEP use relative to states in the U.S. without Medicaid expansion or a PrEP-DAP.
- In 2018, states with a PrEP-DAP had nearly double the rate of PrEP use (100.6 PrEP users per 100,000 population) and double the PrEP-to-Need Ratio (6.4) relative to states without such programs (51.9 PrEP users per 100,000 population and 3.9 PnR).
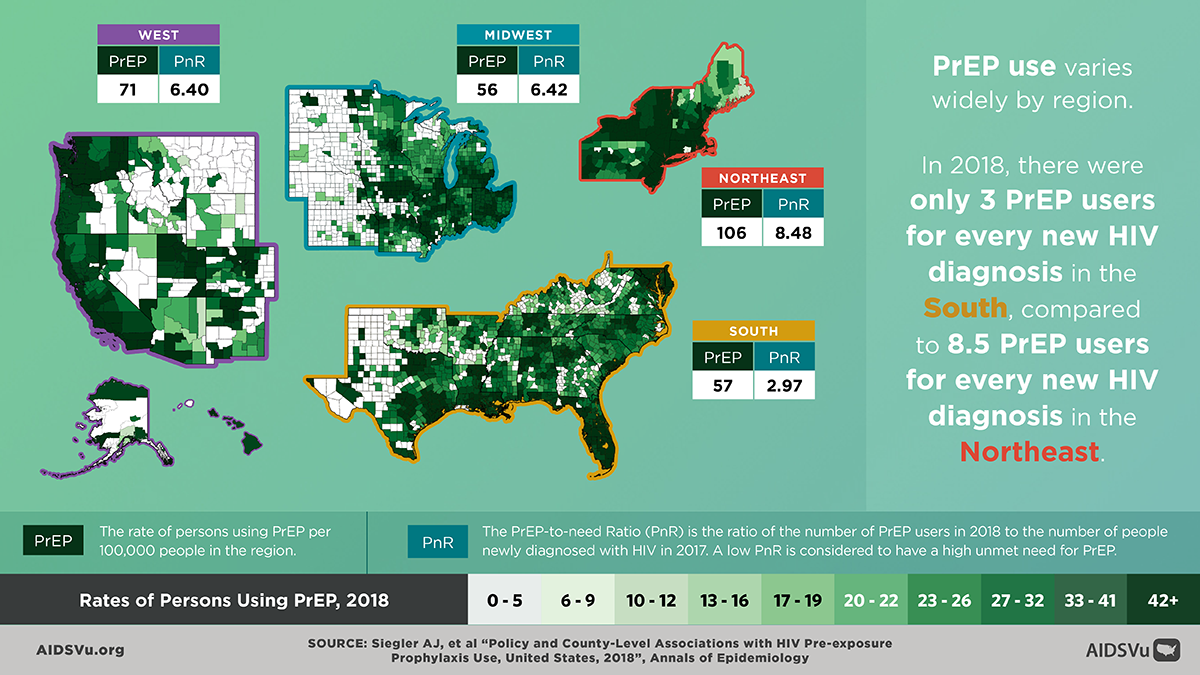
- The PrEP-to-Need Ratio (PnR) is the ratio of the number of PrEP users in 2018 to the number of people newly diagnosed with HIV in 2017. It serves as a measurement of how PrEP use compares to the need for PrEP in a population. For example, a PnR of 3.9 means there were 3.9 PrEP users for every person newly diagnosed with HIV in the population.
- Similarly, U.S. states in 2018 that expanded Medicaid had a PnR that was more than two times higher (6.6) than states that did not expand Medicaid (3.1), indicating fewer PrEP users relative to the need for PrEP in non-Medicaid expansion states.
Among U.S. Census regions, the Northeast had the highest rate of PrEP use (106.3 PrEP users per 100,000 population) and the highest PnR (8.5) in 2018. That same year, the South had the lowest PnR (3.0) despite having a similar rate of PrEP use (58.6 PrEP users per 100,000 population) to the Midwest (56.8 PrEP users per 100,000 population), indicating fewer PrEP users in the South relative to the need for PrEP in that geographic region.
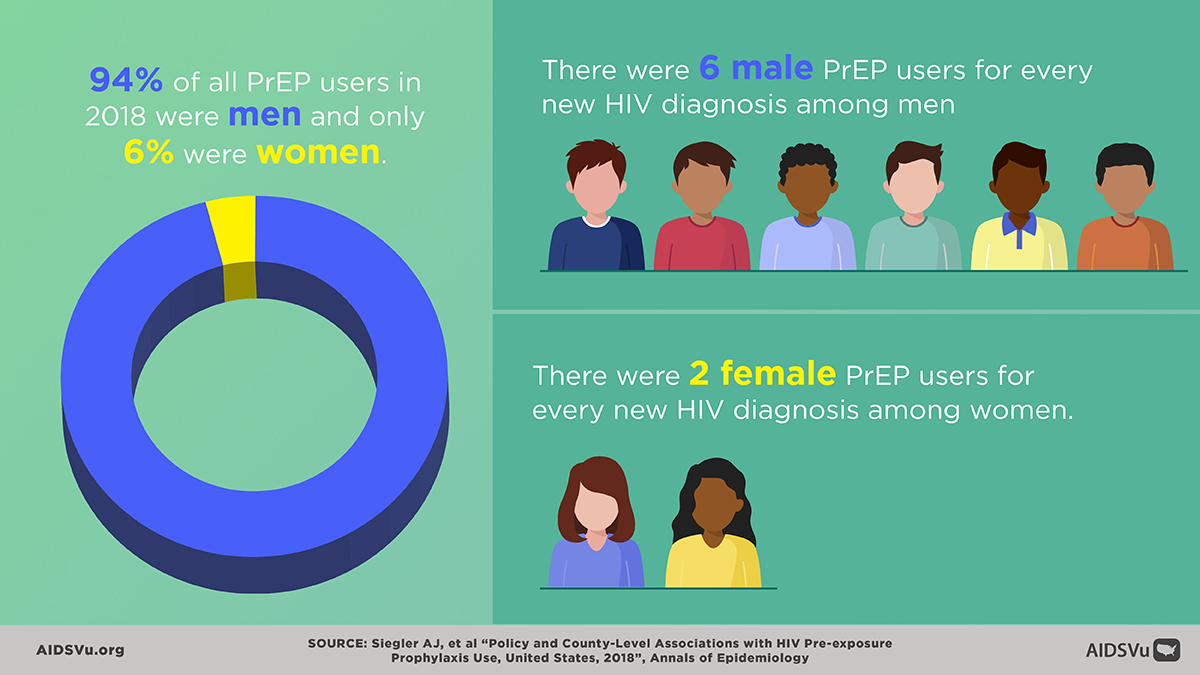
PnR for men (5.7) was 3.5 times higher than for women (1.6) in 2018, indicating fewer PrEP users among women relative to their need for PrEP.
- Out of all PrEP users in 2018, 94% were men and only 6% were women. In comparison, women represented 19% of all new HIV diagnoses in 2018.
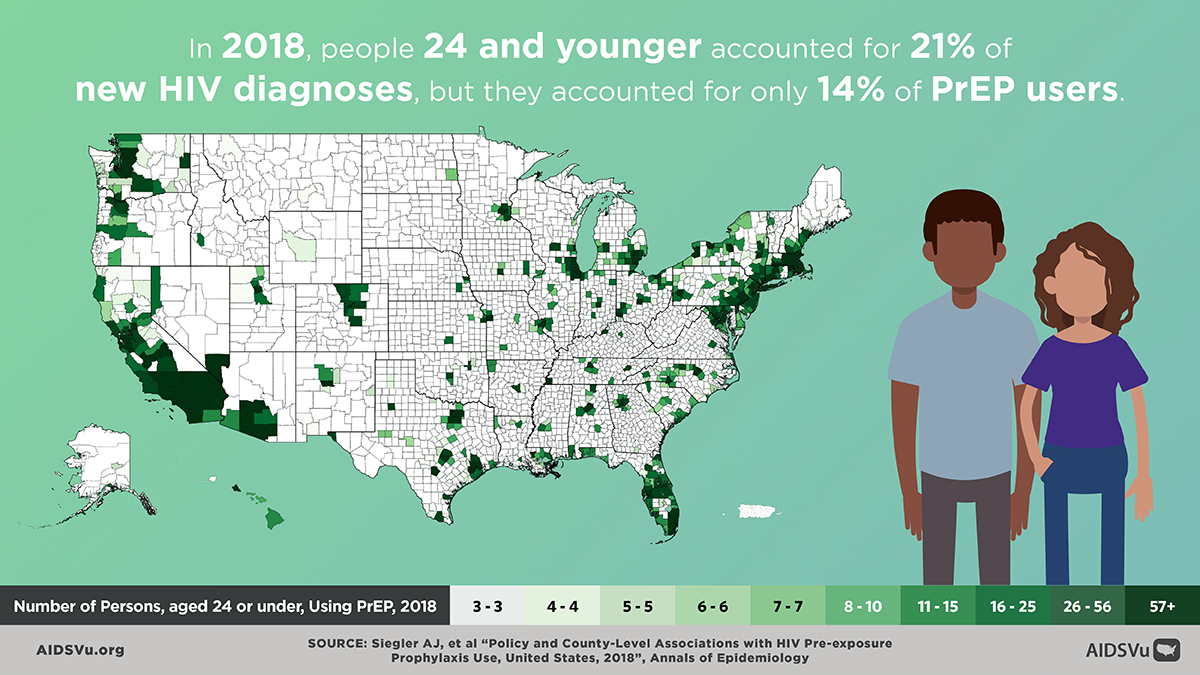
In 2018, the rate of PrEP use and PnR were lowest in those under age 25 (51.5 PrEP users per 100,000 population and 3.3 PnR) and over age 54 (15.9 PrEP users per 100,000 population and 3.7 PnR).
- People 24 and younger accounted for only 14% of PrEP users in 2018, while representing 21%* of new HIV diagnoses.
- The PnR for those 24 and younger was lowest (3.3), while the PnR for those 35-44 was almost twice as high (6.1) in 2018, indicating fewer PrEP users relative to the need for PrEP among those 24 and younger.
- Note: FDA approval for PrEP in adolescents did not occur until mid-2018, which may contribute to relatively low PrEP use in those under 18 years of age.
*Data are preliminary data obtained from CDC ATLAS https://www.cdc.gov/nchhstp/atlas/index.htm.
County-level Insights
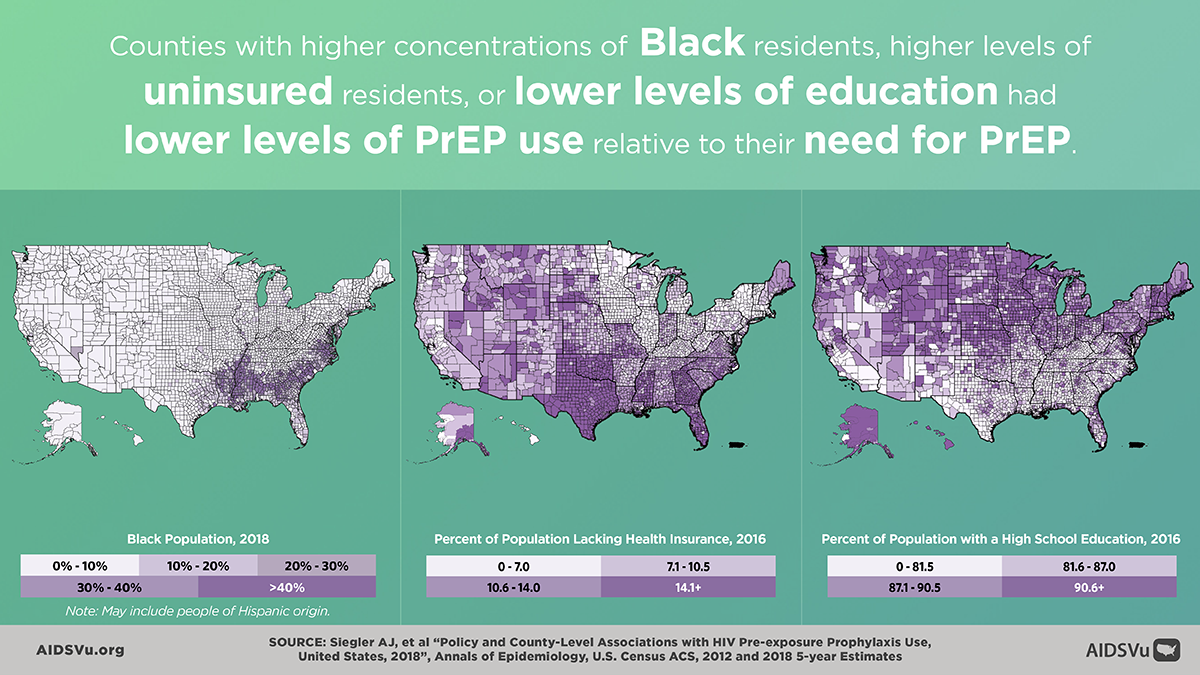
U.S. counties with the highest proportion of Black residents in 2018 had a higher rate of PrEP use (87.8 PrEP users per 100,000 population) but lower overall PnR (3.4) relative to counties with the lowest proportion of Black residents (41.1 PrEP users per 100,000 population and 7.6).
- In other words, U.S. counties with the lowest number of Black residents had an overall PnR that was over two times higher (7.6) when compared to counties with the highest number of Black residents (3.4). The lower PnR among counties with the highest proportion of Black residents indicates fewer PrEP users relative to the need for PrEP. Therefore, in 2018 there were 3.4 PrEP users for every person newly diagnosed with HIV in these counties, compared to 7.6 PrEP users for every new HIV diagnosis in counties with the lowest proportion of Black residents.
- Among U.S. counties, each 5% increase in the proportion of Black residents was associated with a 5% lower overall PnR.
U.S. counties with the highest proportion of Latinx residents in 2018 had a higher rate of PrEP use (90.8 PrEP users per 100,000 population) but moderately lower overall PnR (4.5) relative to counties with the lowest proportion of Latinx residents (40.5 PrEP users per 100,000 population and 4.7). The moderately lower PnR among counties with the highest proportion of Latinx residents indicates fewer PrEP users relative to the need for PrEP.
In 2018, there was a 5% decrease in PnR in counties for each 5% increase in levels of uninsured residents or poverty, indicating lower PrEP use than need for PrEP in counties more impacted by poverty or lack of health insurance. Conversely, there was a 5% increase in PnR for counties with higher proportions of residents with a bachelor’s degree.
Share our Infographics

Ending the HIV Epidemic: A Plan for America Insights
Ending the HIV Epidemic: A Plan for America (EHE) is a ten-year federal initiative from the U.S. Department of Health & Human Services (HHS) that aims to reduce new HIV infections by 75% by 2025 and by at least 90% by 2030. The first phase of the plan focuses efforts and resources in 48 counties, plus San Juan, PR and Washington, DC, where more than half of all new HIV diagnoses occurred in 2016 and 2017, along with seven states (Alabama, Arkansas, Kentucky, Mississippi, Missouri, Oklahoma, and South Carolina) with a substantial rural HIV burden.
Dr. Patrick Sullivan, in an article in Annals of Epidemiology, studied PrEP use in EHE jurisdictions and found:
- In 2018, 39% of PrEP users in the 48 EHE counties were 25- to 34-years old.
- In 2018, 94% of PrEP users in the 48 EHE counties were men and 6% were women.
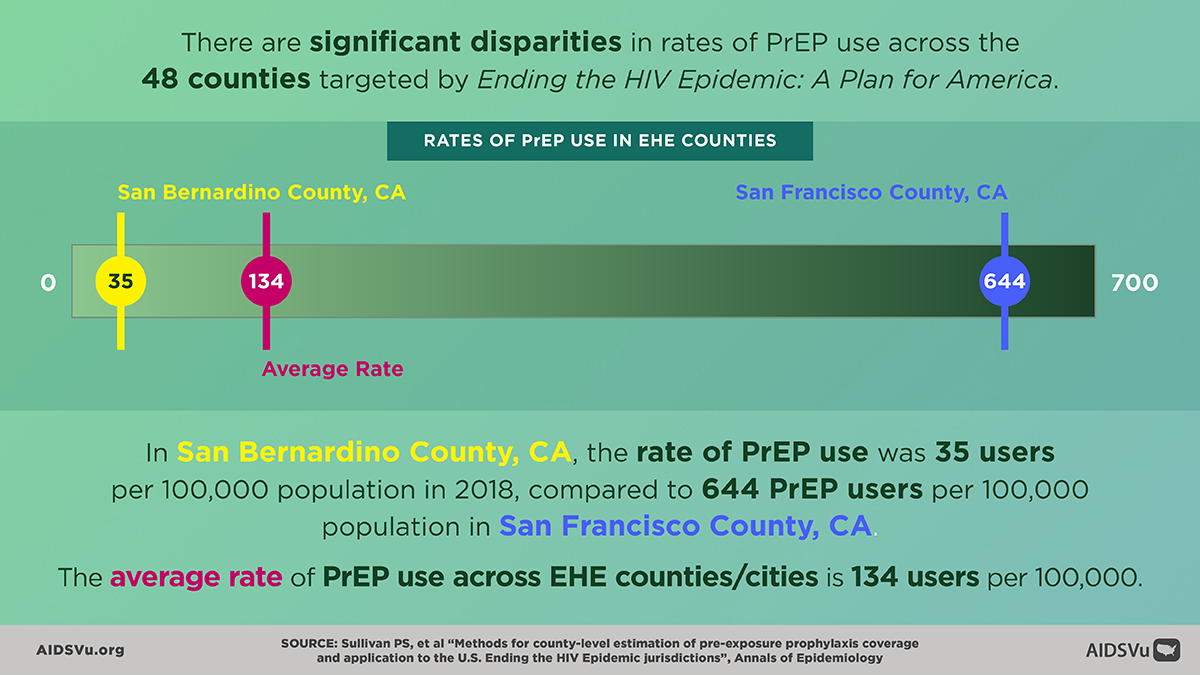
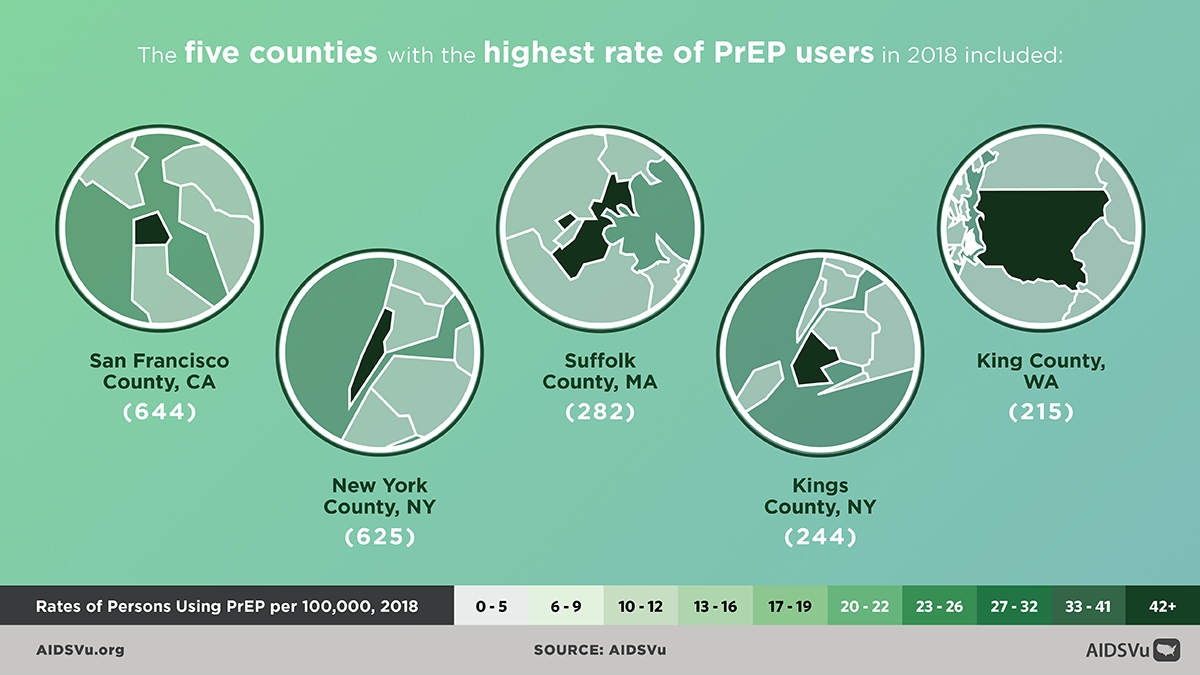
- Almost half (49%) of PrEP users in the U.S. in 2018 were living in the 48 counties targeted by the EHE initiative, but there were significant disparities in PrEP use among counties. For example, in San Bernardino County, Calif., the rate of PrEP use was 35 PrEP users per 100,000 population compared to 644 PrEP users per 100,000 population in San Francisco County, CA.
- The average rate of PrEP use among all EHE counties and cities was 134 PrEP users per 100,000 population.
- There were also significant disparities in access to PrEP services among EHE jurisdictions. For example, the number of PrEP-providing clinics ranged from 0.3 per 100,000 population in Cobb County, GA to 6.1 per 100,000 population in San Francisco County, CA, with a median of 1.7 PrEP-providing clinics per 100,000 population across the 48 counties.
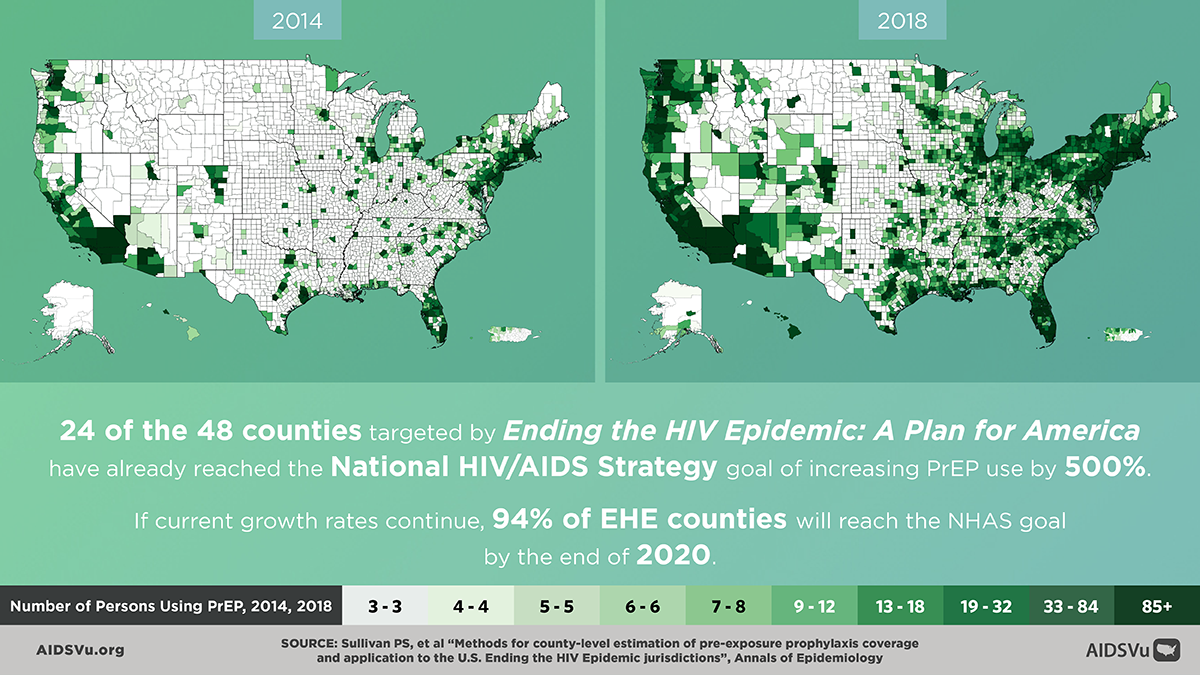
- By 2018, 24 of the 48 counties, Washington, DC, and San Juan, PR had achieved the National HIV/AIDS Strategy (NHAS) goal to increase PrEP use by 500% from 2015 to 2020. If current PrEP use rates continue, 94% of EHE counties will achieve the NHAS goal by the end of 2020.
Share our Infographics