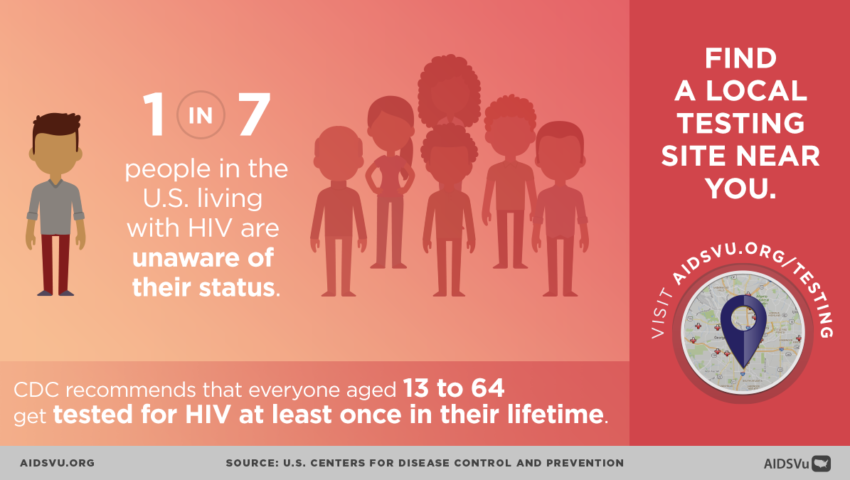
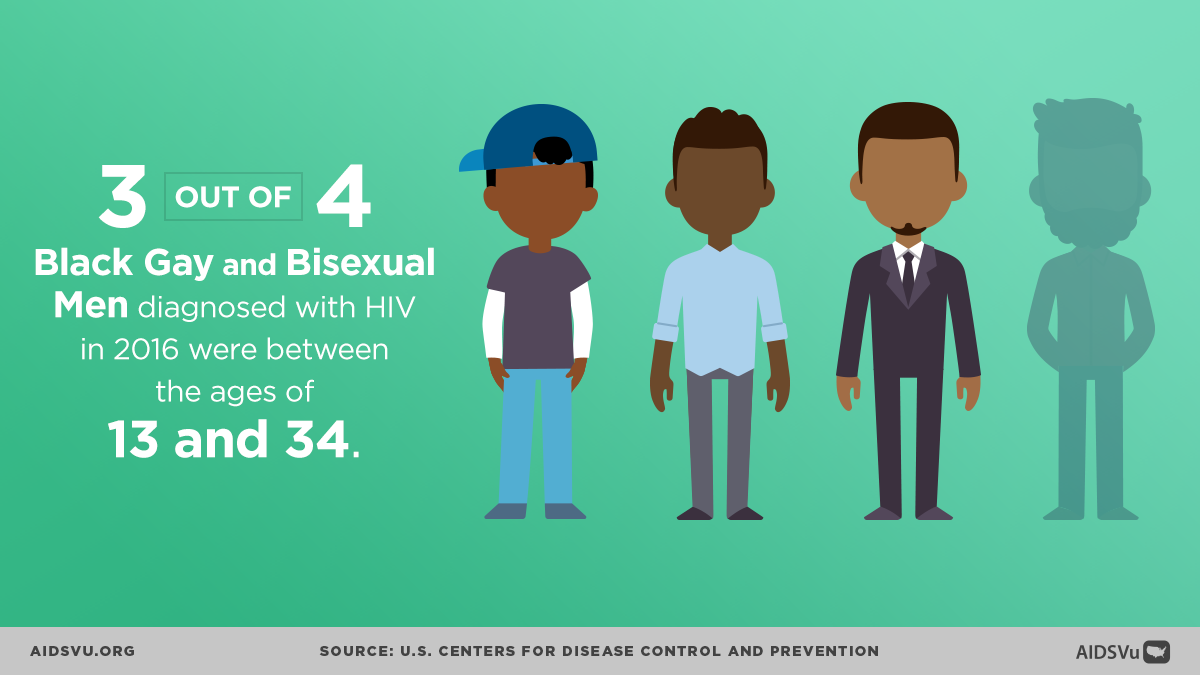
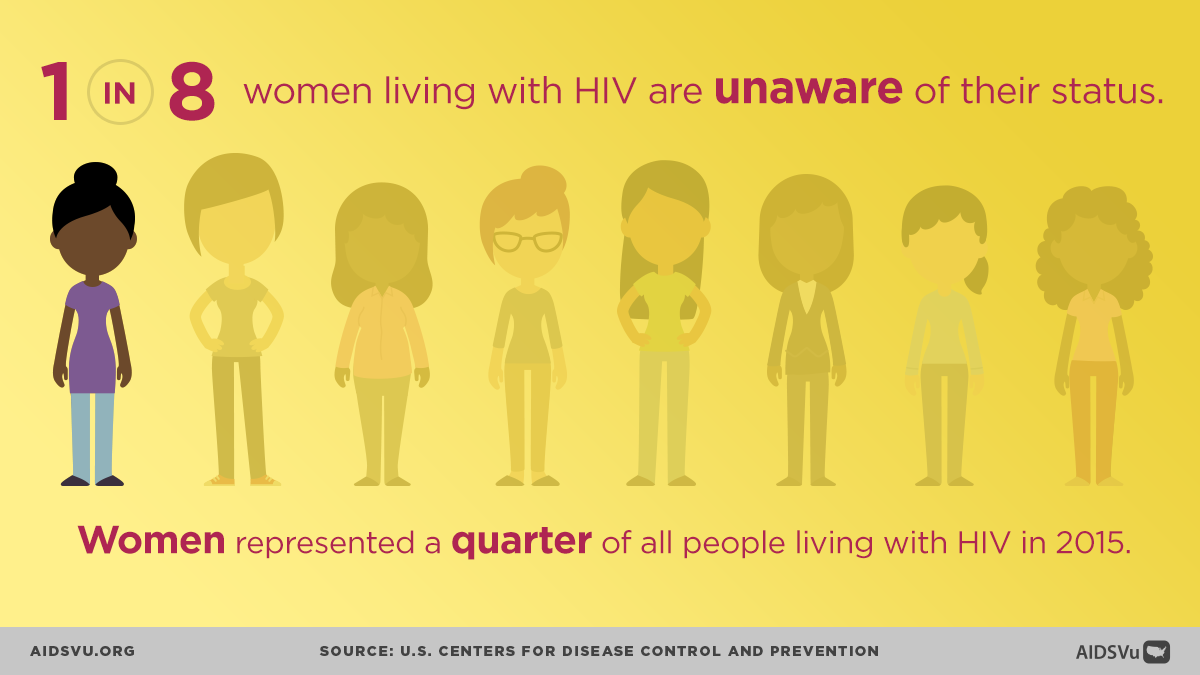
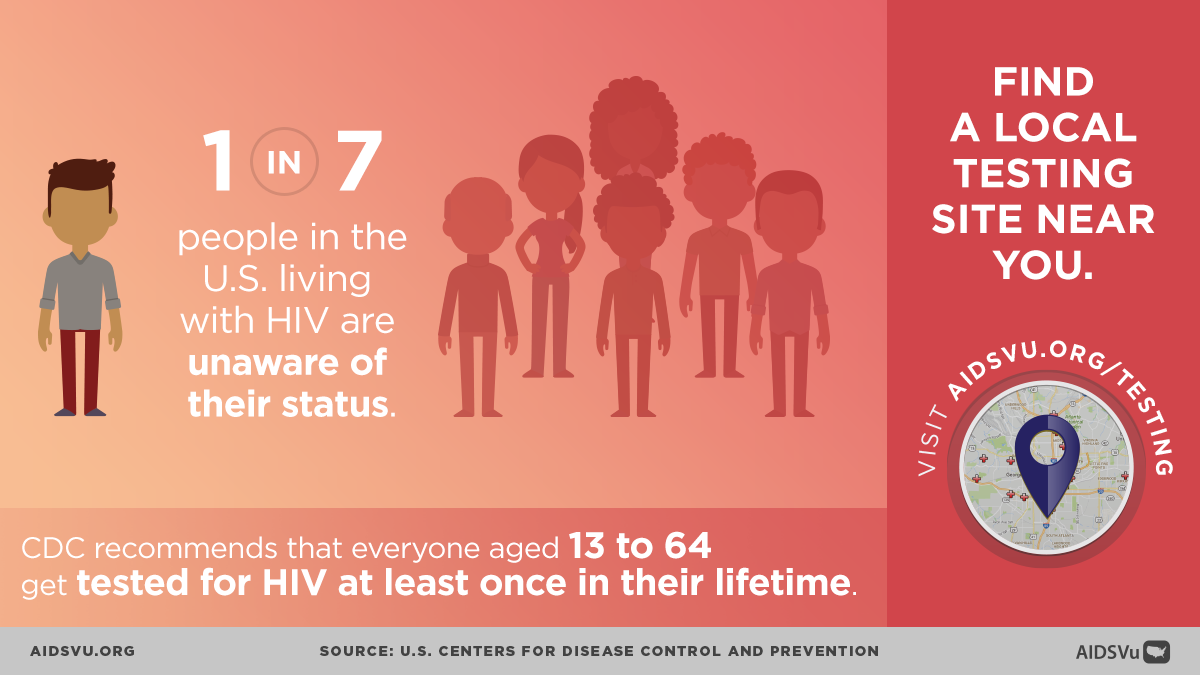
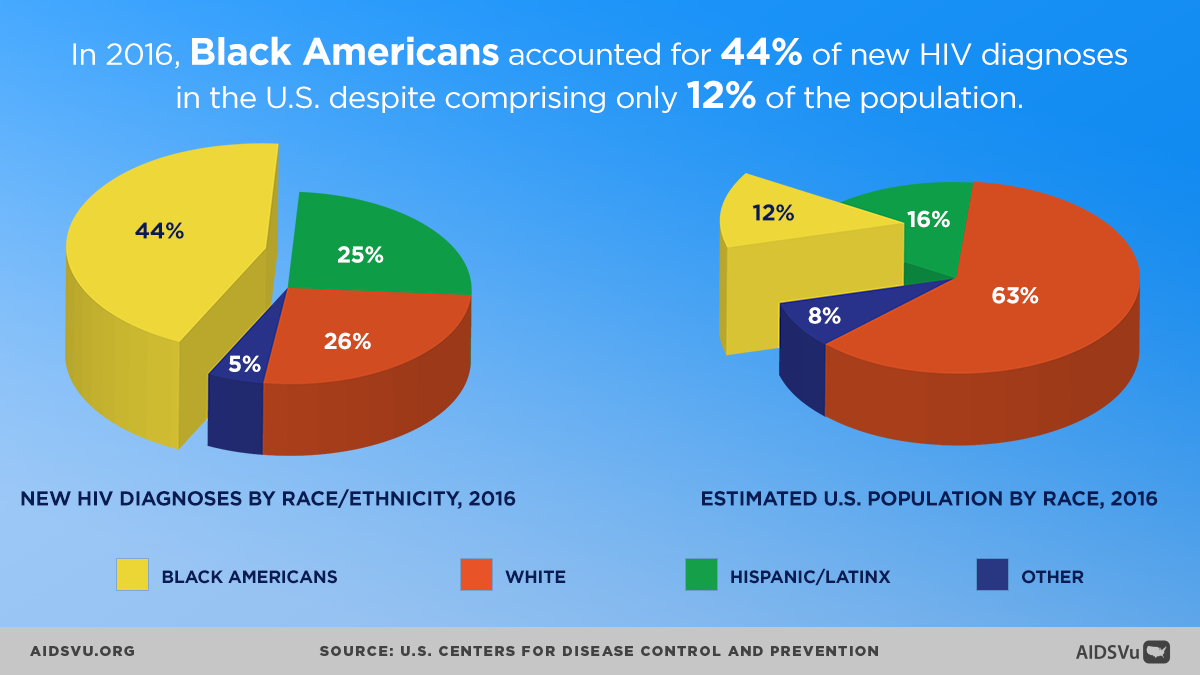
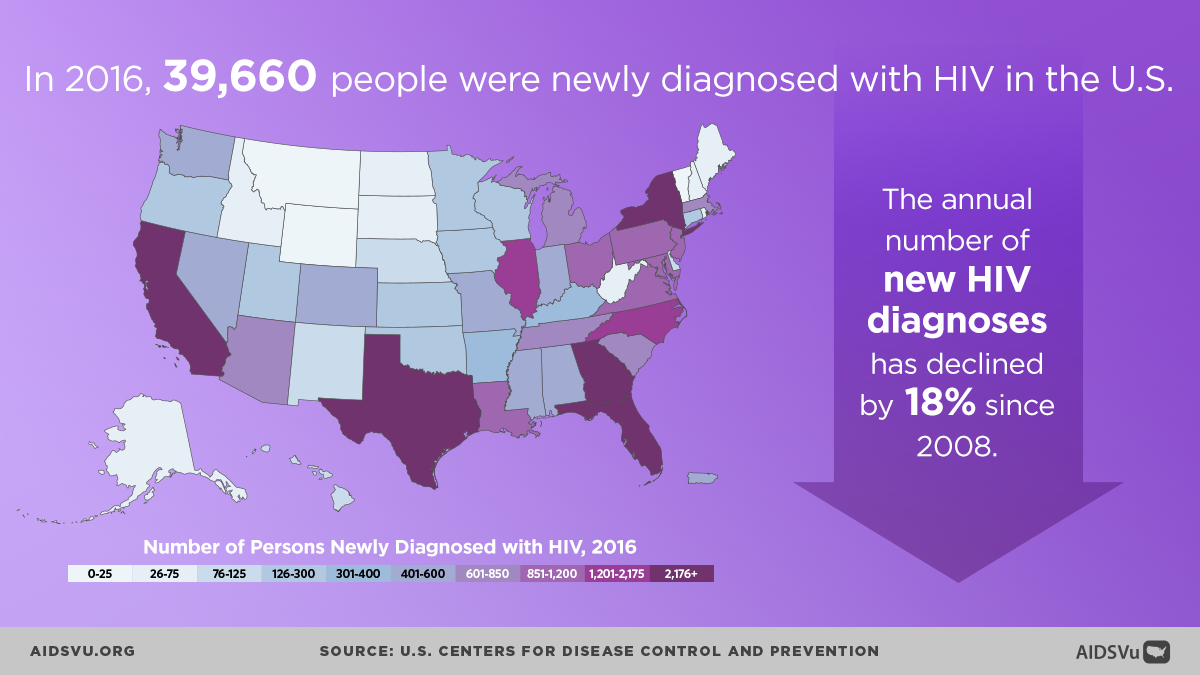
Nearly 40,000 people are newly diagnosed with HIV each year in the United States. While the number of new HIV diagnoses has declined by 18% since 2008, 1 in 7 people living with HIV are still unaware of their status. On June 27th, AIDSVu recognizes National HIV Testing Day and encourages everyone to know their status and get tested for HIV.
Widespread HIV testing and access to comprehensive HIV prevention and care services are critical components of our national response to the HIV epidemic. Visit our service locators to find HIV testing sites in your area.
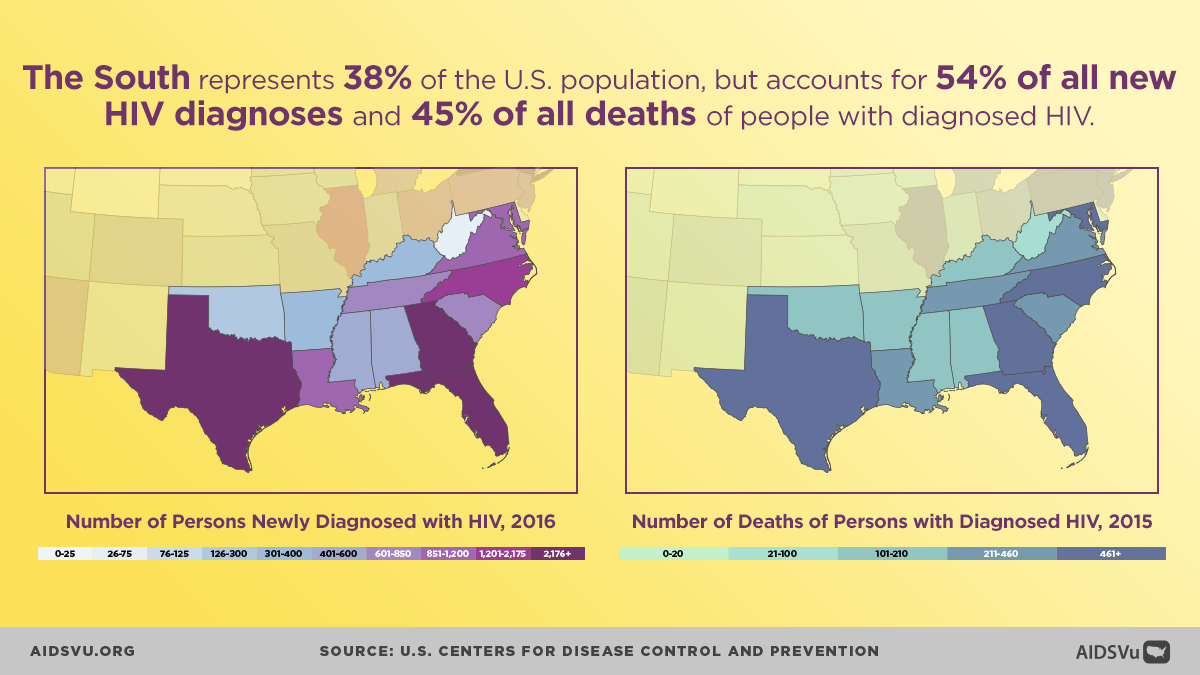
Today, AIDSVu is also releasing the annual update of its interactive maps illustrating the impact of HIV across the United States. Using the latest publicly available data at the city-, county-, and state-levels, these new maps visualize disparities in HIV infections and mortality, both geographically and across different demographic groups. Click here to see the maps.
Visualizing HIV-related data helps people understand that where you live matters when it comes to being at risk for HIV. On this National HIV Testing Day, learn more about the HIV epidemic where you live and share AIDSVu resources in your outreach.
Share our Infographics
About AIDSVu’s Annual Data Update
AIDSVu is a project of Emory University’s Rollins School of Public Health in partnership with Gilead Sciences, Inc. Now in its eighth year, AIDSVu continues to advance its mission to make HIV data widely available, easily accessible, and locally relevant to inform public health decision making. The site aims to provide researchers, policymakers, and community members with a more comprehensive understanding of the HIV epidemic at the local-, state-, and national- level.
Major data updates for 2018 include:
- State- and county-level data showing HIV prevalence (2015), and new HIV diagnoses (year-over-year for 2008 to 2016).ZIP code-level maps showing HIV prevalence (2016) and new diagnoses data (cumulative 2012 to 2016) for 41 U.S. cities, representing more than 60 percent of the U.S. HIV epidemic.
- Mortality data at the state level, showing rates and number of deaths that occurred among people with diagnosed HIV (2015).
- Enhanced state and city data profile pages including new diagnoses and HIV care continuum data, and data for the estimated number of transgender people living with diagnosed HIV (2016) for 31 cities.
- HIV maps alongside maps of social determinants of health – such as poverty, high school education, median household income, income inequality, and people without health insurance.
- HIV prevention, testing and treatment locator maps, including housing opportunities for persons with AIDS, and NIH-funded HIV prevention, vaccine, and treatment trial locations viewable on AIDSVu’s interactive maps.
New features include:
- State- and county-level data on rates of HIV infection among men who have sex with men (MSM) per 100 MSM. Rates are developed utilizing the first population estimates of MSM in every state and county in the U.S.
- Modernized AIDSVu website with improved navigation, easy to find resources, and more robust content.
State- and county-level data displayed on AIDSVu were obtained from Centers for Disease Control and Prevention and compiled by researchers at the Rollins School of Public Health. ZIP Code, census tract, and community area/ward data were provided by state and city health departments, depending on the entity responsible for HIV surveillance. Learn more about AIDSVu’s data sources here.
Learn From Experts
Read our series of AIDSVu Q&A’s with leading HIV experts to learn more about the epidemic.

