On June 27th, AIDSVu recognizes National HIV Testing Day and encourages everyone to get tested for HIV and know their status.
National HIV Testing Day also marks the annual update of AIDSVu’s interactive maps, illustrating the impact of HIV across the U.S. and continuing AIDSVu’s commitment to providing public health officials, policymakers, healthcare professionals, researchers, and community leaders with a more comprehensive view of the national HIV epidemic. Using the latest available data at the county- and state-levels, AIDSVu’s maps visualize disparities in HIV infections, mortality, and PrEP use both geographically and across different demographic groups. Earlier this year, AIDSVu released updated ZIP Code-level maps for nearly 40 cities across the U.S.
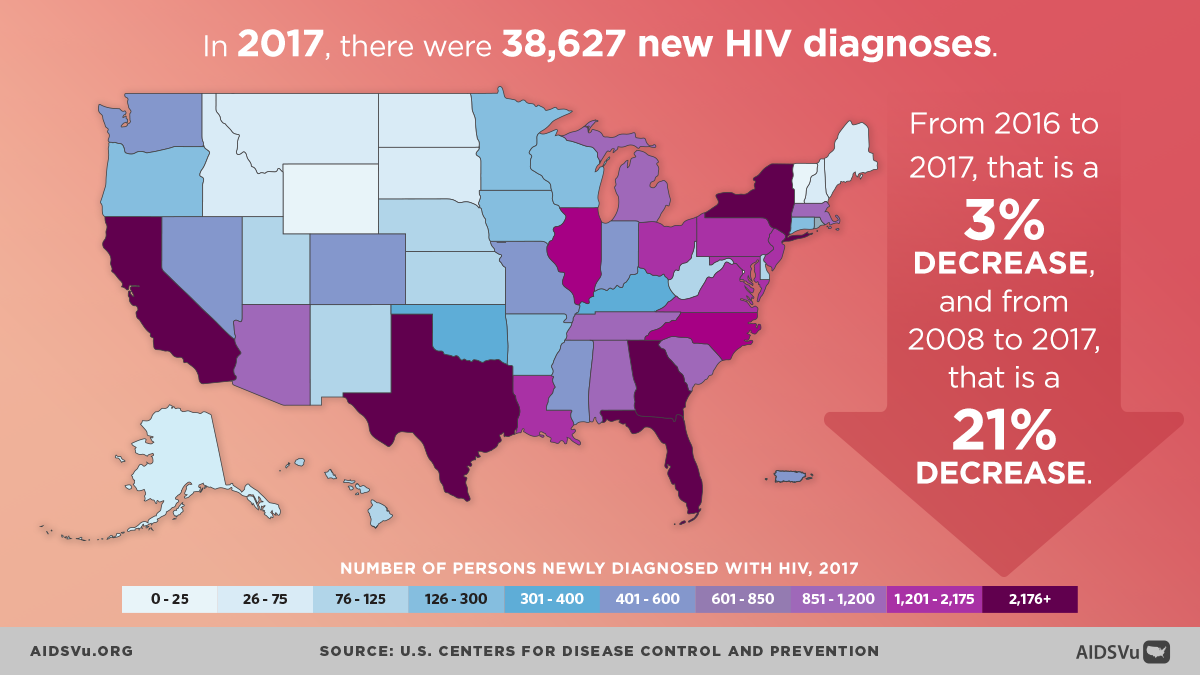
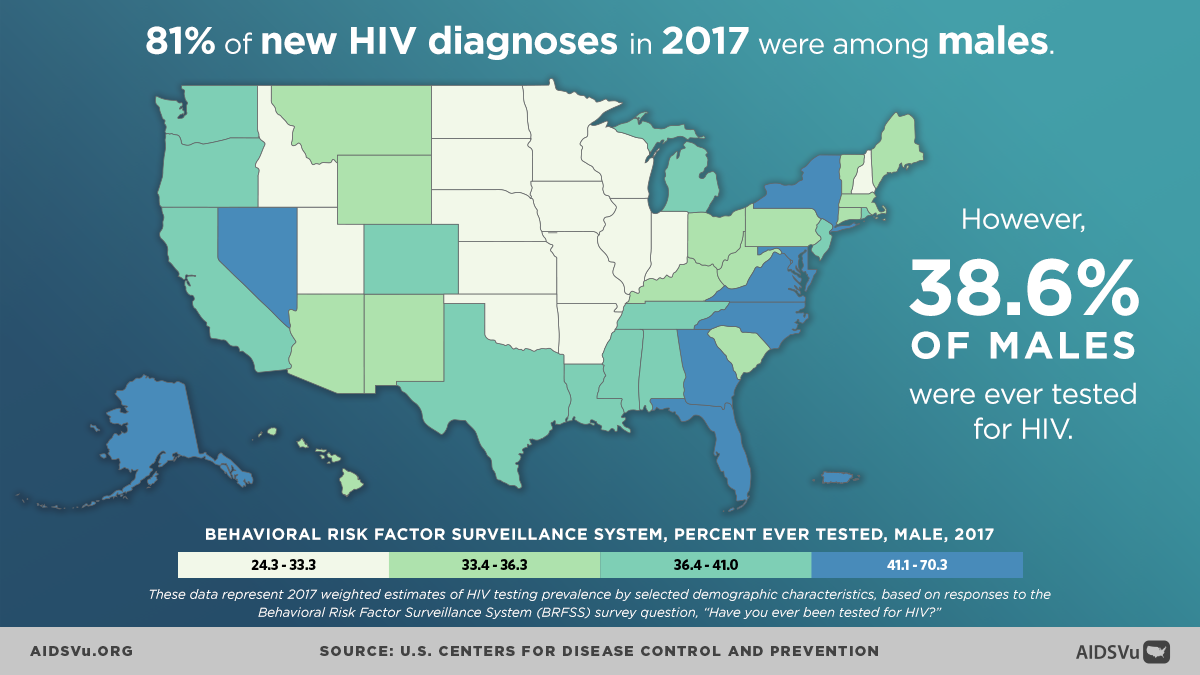
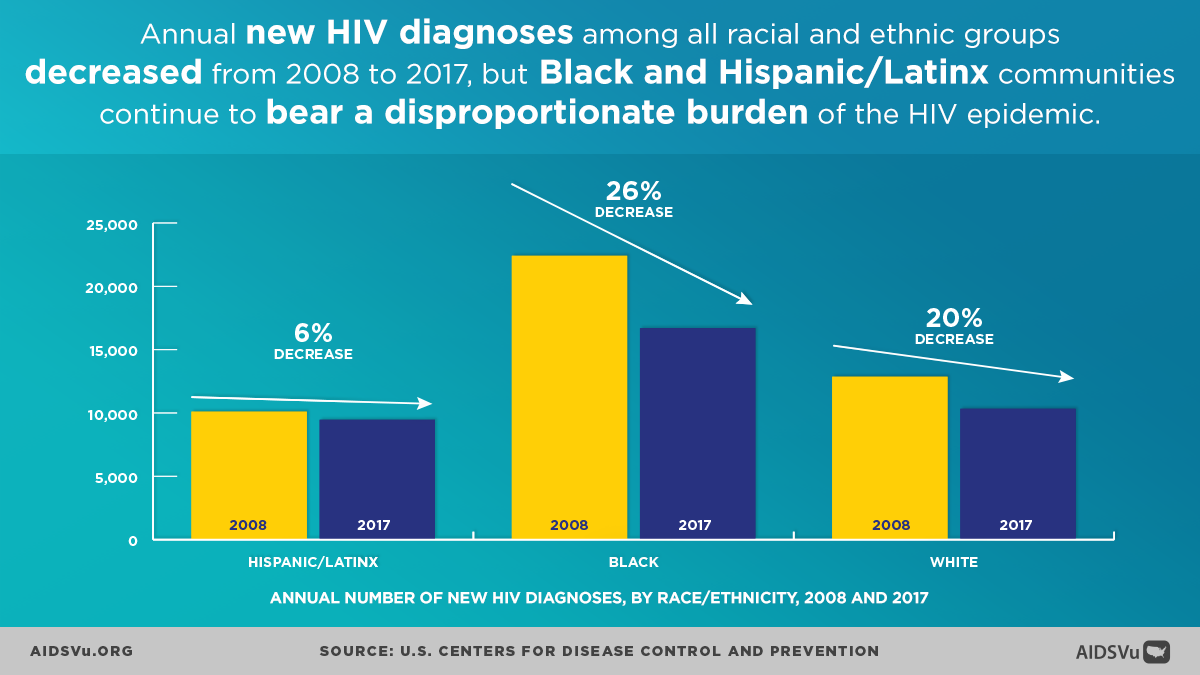
In 2017, there were more than 38,000 new HIV diagnoses in the U.S. and Puerto Rico. While the annual number of new HIV diagnoses has declined overall, certain populations continue to be disproportionately impacted by HIV, including the Black and Hispanic/Latinx communities and gay, bisexual, and other men who have sex with men (MSM).
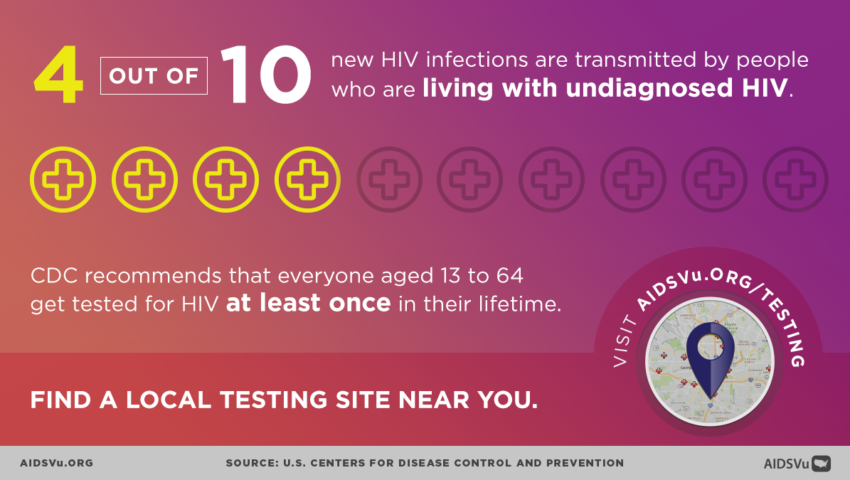
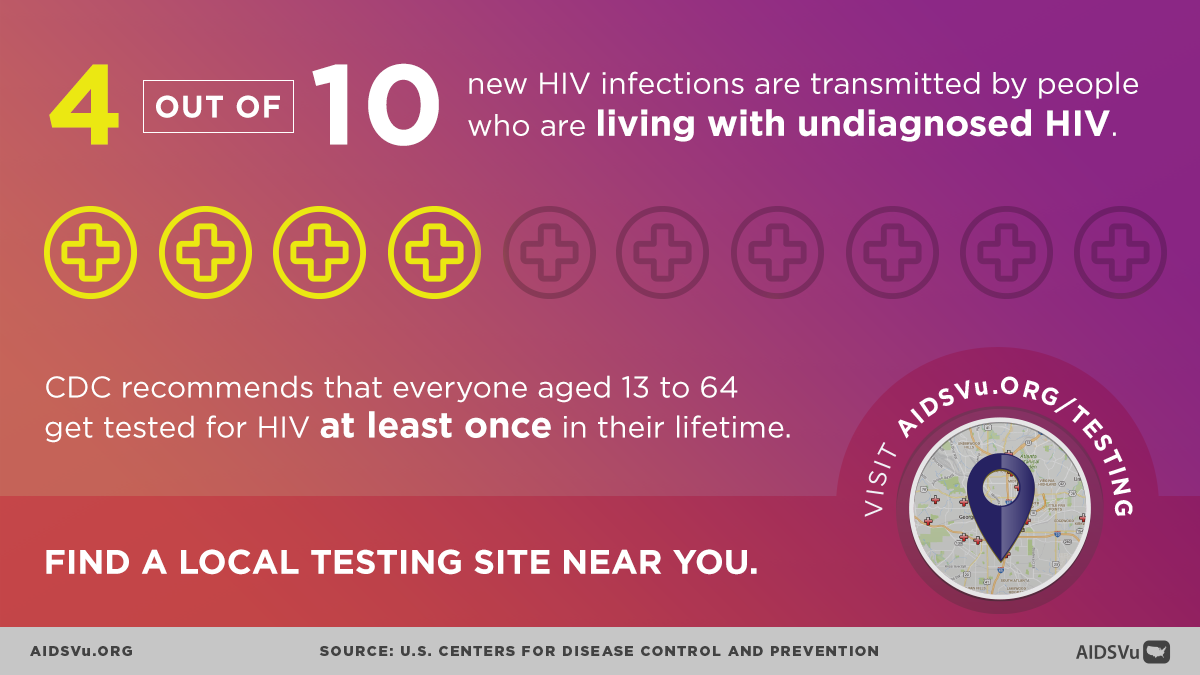
An estimated 1.1 million people in the U.S. have HIV, and 1 in 7 people living with HIV are unaware of their status. According to CDC, 4 out of 10 new HIV infections are transmitted by people living with undiagnosed HIV, underscoring the critical importance of getting tested, knowing your status, and getting into care and treatment right away if you have HIV.
Visit our service locators to find HIV testing sites in your area.
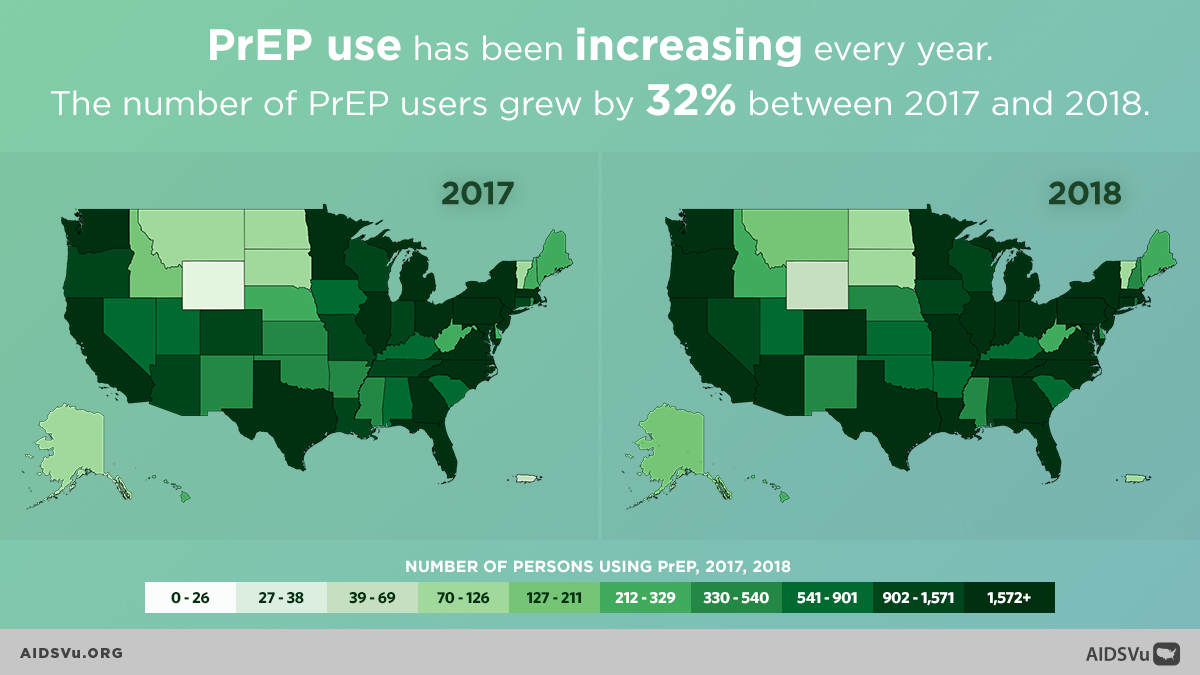
The updated data and maps on AIDSVu show that HIV continues to disproportionately impact the South with 52% of all new HIV diagnoses occurring in the southern region of the U.S. in 2017. The South, however, only accounted for 32% of PrEP users in 2018. While PrEP use has been increasing year to year—including a 32% increase in PrEP users from 2017 to 2018—the data on AIDSVu underscore the need to continue expanding access to PrEP and other comprehensive HIV prevention strategies across populations and geographic regions.
Visualizing HIV-related data helps people understand that where you live matters when it comes to being at risk for HIV. On this National HIV Testing Day, learn more about the HIV epidemic where you live and share AIDSVu resources in your outreach. Click here to learn more about how HIV impacts the U.S.
Major data updates for 2019 include:
- State- and county-level data showing HIV prevalence (2016), and new HIV diagnoses (year-over-year for 2008 to 2017).
- Mortality data at the state level, showing rates and number of deaths that occurred among people with diagnosed HIV (2016).
- State-level PrEP rates and users data (2018), which can be stratified by age and sex, as well compared to social determinants of health data.
- Enhanced state and local data profiles including new diagnoses and HIV care continuum data.
- ZIP Code-level data showing HIV prevalence (2017) for nearly 40 U.S. cities
- Comparison maps of social determinants of health – such as poverty, high school education, median household income, income inequality, and people without health insurance.
- Locations for HIV prevention, testing, and Ryan White care services, as well as locations of housing opportunities for persons with AIDS and NIH-funded HIV prevention, vaccine, and treatment trial locations, all viewable on AIDSVu’s interactive maps.
About AIDSVu’s Annual Data Update
AIDSVu is a project of Emory University’s Rollins School of Public Health in partnership with Gilead Sciences, Inc. Now in its ninth year, AIDSVu continues to advance its mission to make HIV data widely available, easily accessible, and locally relevant to inform public health decision making. The site aims to provide researchers, policymakers, and community members with a more comprehensive understanding of the HIV epidemic at the local-, state-, and national-level.
State- and county-level data displayed on AIDSVu were obtained from the Centers for Disease Control and Prevention and compiled by researchers at the Rollins School of Public Health. PrEP use data were obtained from Symphony Health’s national, patient-level prescription data source that represents more than 54,000 pharmacies, 1,500 hospitals, 800 outpatient facilities, and 80,000 physician practices across the U.S. These data are a conservative, or minimum, number of PrEP users in each state in the U.S. by year, and the actual number of PrEP users is higher. ZIP Code, census tract, and community area/ward data were provided by state and city health departments, depending on the entity responsible for HIV surveillance. Learn more about AIDSVu’s data sources here.

