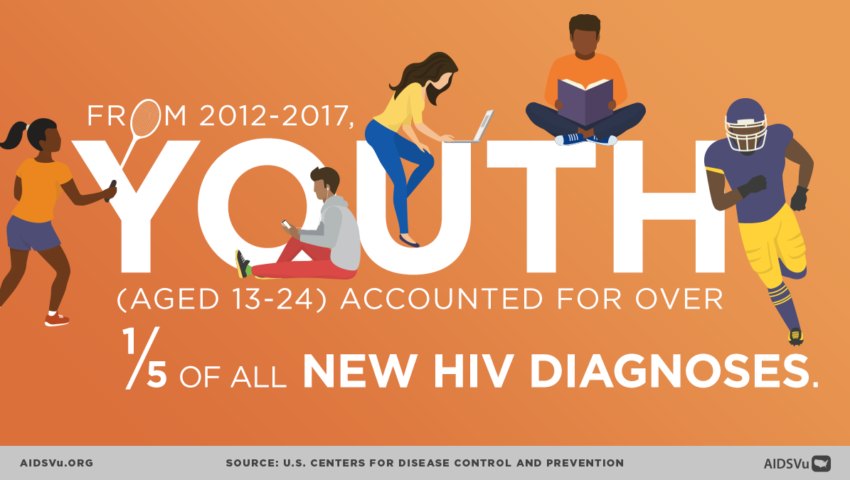
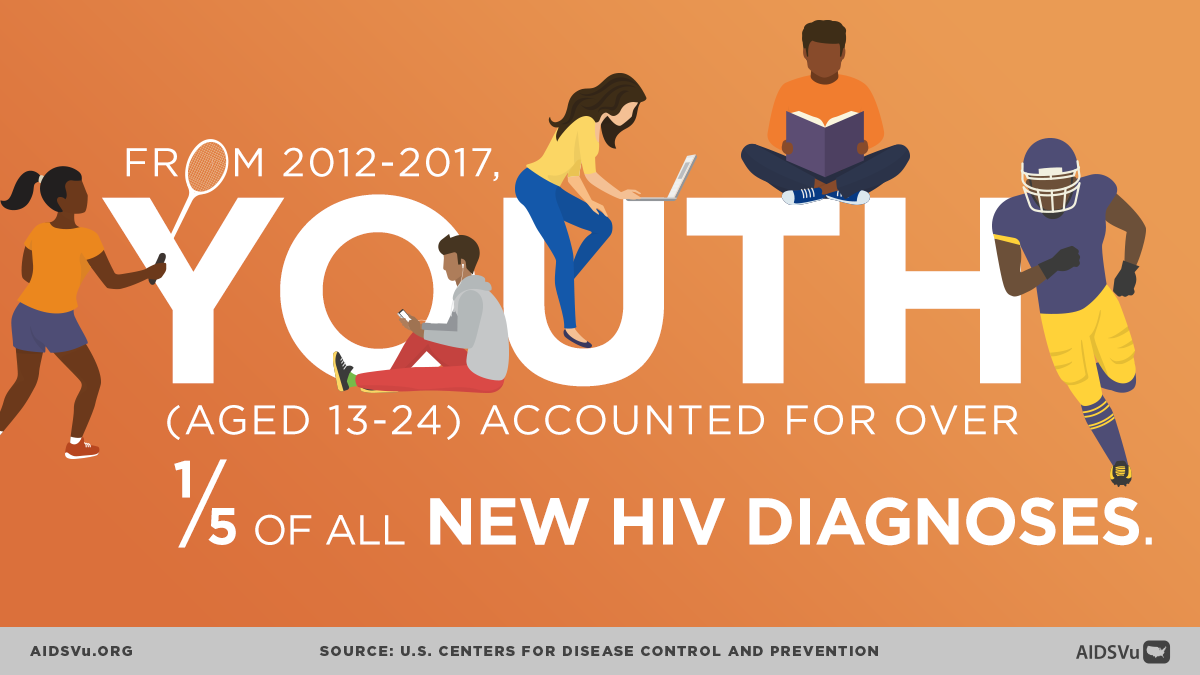
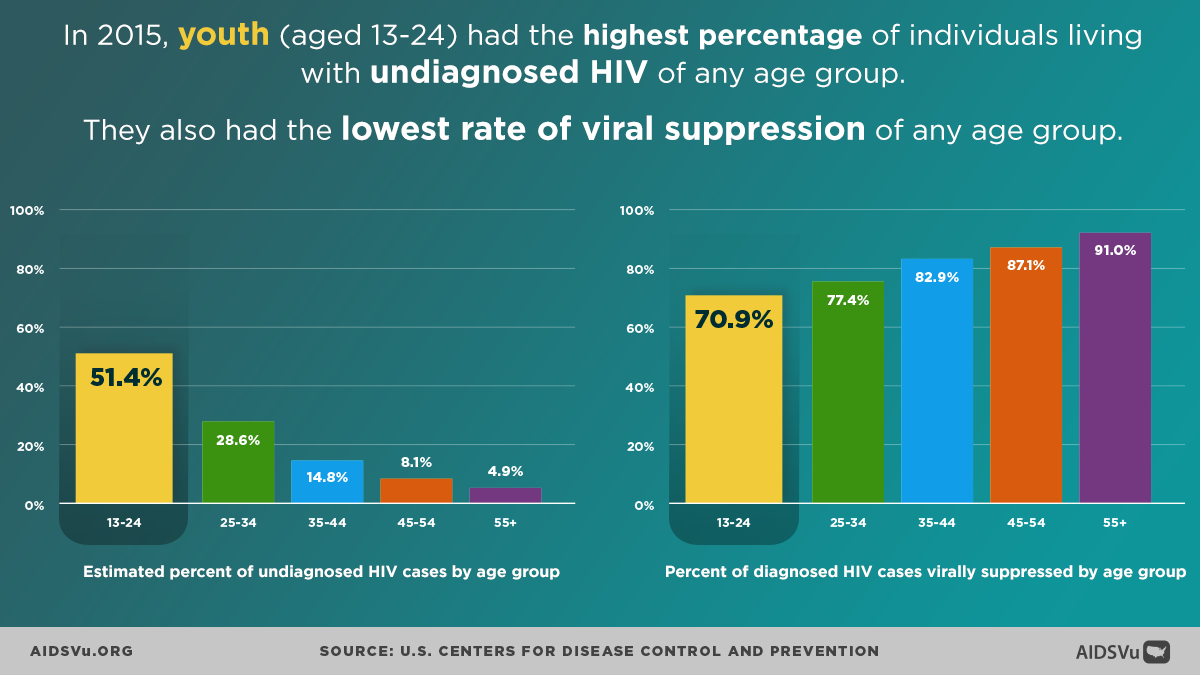
According to the Centers for Disease Control and Prevention (CDC), youth (aged 13-24) accounted for 20% of all new HIV diagnoses from 2012-2017. In 2015, CDC reported that youth had the highest percentage (51%) of individuals living with undiagnosed HIV, demonstrating a clear need for expanding awareness of and access to HIV prevention and testing services for young people.
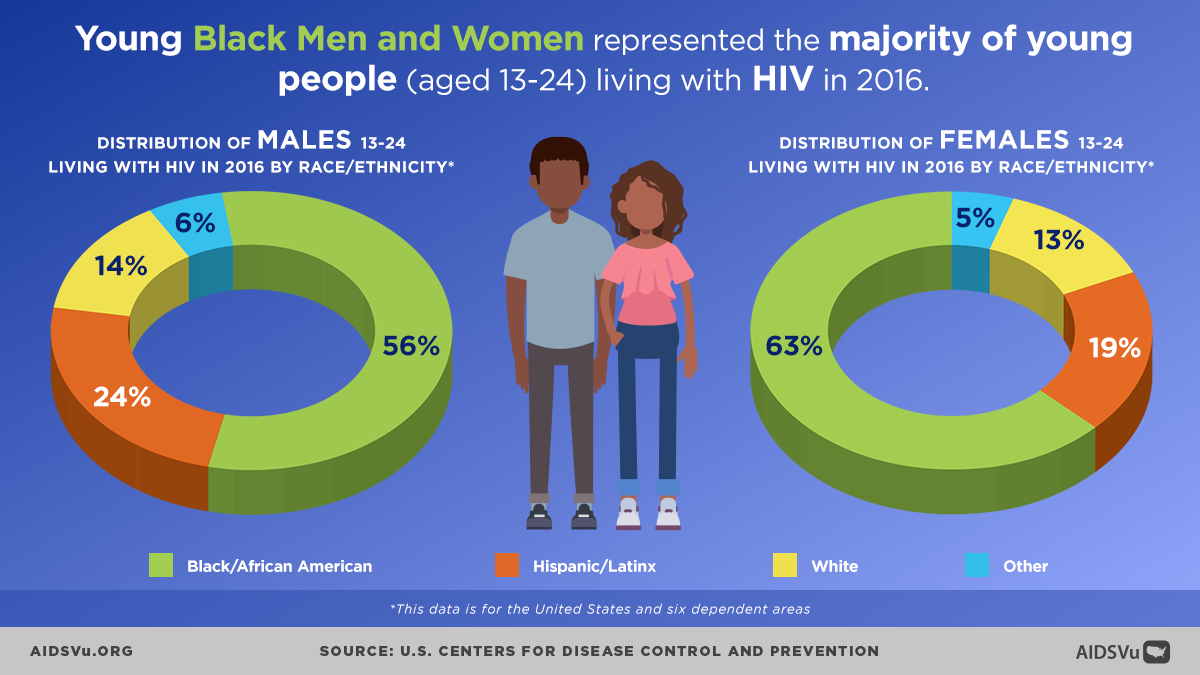
Further, when breaking down the statistics for HIV among youth, the majority of young people living with HIV in 2016 were Black, and 80% of all new HIV diagnoses in 2017 among youth were attributed to male-to-male sexual contact.
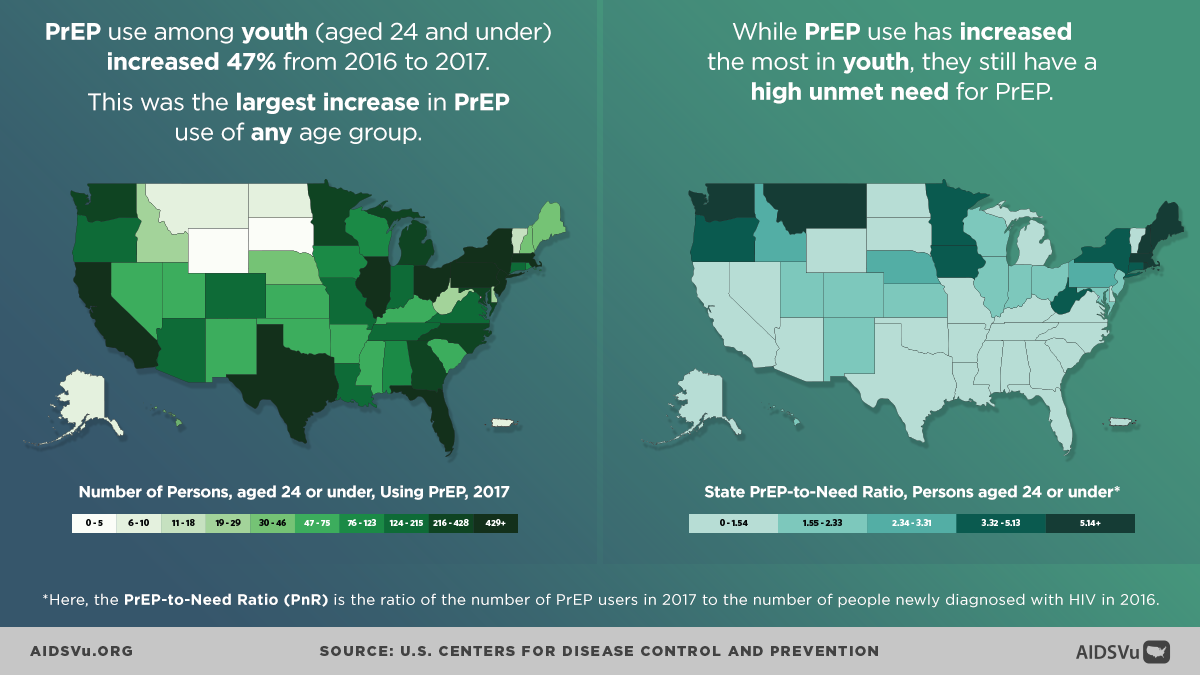
One of the most effective tools to reduce HIV rates is PrEP or, pre-exposure prophylaxis. PrEP is for people at high risk of HIV to lower their chances of getting infected. CDC has estimated that approximately 1.1 million people are at high risk for HIV exposure and could benefit from comprehensive HIV prevention strategies, including PrEP. PrEP use among youth (aged 24 and under) has increased 47% from 2016 to 2017, the largest increase in PrEP use of any age group. However, the overall level of PrEP use among youth still remains low relative to their need for HIV prevention. The PrEP-to-need ratio—the ratio of the number of PrEP users to the number of people newly diagnosed with HIV—among youth is the lowest of any age group.
On National Youth HIV/AIDS Awareness Day, get involved and join the fight against HIV:
EDUCATE FAMILY AND FRIENDS: View our local statistics to see how HIV impacts your community.
LEARN MORE: Check out CDC’s page on HIV Among Youth to learn the prevention challenges and the work the CDC is doing.
GET TESTED: Visit AIDSVu.org/testing to find a testing site near you.
FIND PREVENTION: Use AIDSVu’s PrEP locator to find a local PrEP provider.
Infographic 1: The 2017 HIV Surveillance Report (Table 1a)
Infographic 2: The 2010-2015 HIV Surveillance Supplemental Report (Table 7), 2017 CDC HIV Monitoring Surveillance Report (Table 5a)
Infographic 3: The CDC HIV Surveillance Slide Deck – Adolescent and Young Adults (Slide 4)
Infographic 4: AIDSVu
Infographic 5: 2017 CDC HIV Surveillance Report (Tables 7a, 8a, 9a)

