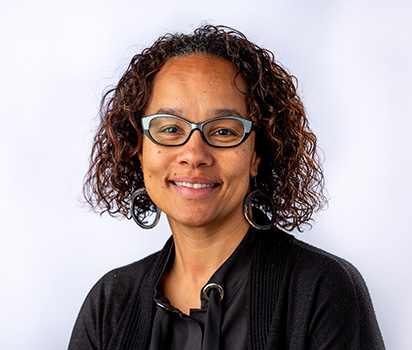
Nanette Benbow, Senior Policy Advisor and Research Assistant Professor, Northwestern University, Feinberg School of Medicine, and AIDSVu Advisory Committee member
David Holland, MD, MHS, Associate Professor, Emory University Department of Medicine, Fulton County Board of Health, Communicable Disease Prevention Branch
AIDSVu spoke with Nanette Benbow about the HIV care continuum, the importance of viral suppression, and how visualizing city-level continuum data on AIDSVu helps policymakers target interventions. Dr. David Holland spoke about the HIV care continuum on the local level in Atlanta.
Nanette Benbow:
Q: What is the HIV care continuum and why is viral suppression an important marker for progress on ending HIV?
NB: The HIV care continuum is a public health framework that describes the various steps that people with HIV go through from diagnosis to achieving and maintaining viral suppression. The ultimate goal of HIV treatment is to achieve and maintain viral suppression, which means that the amount of HIV in the body is very low or undetectable until there’s minimal risk of passing HIV to others.
There are five parts of the HIV care continuum, as mapped on AIDSVu:
- new HIV diagnosis
- late HIV diagnosis
- linkage to HIV medical care
- receipt of HIV medical care
- viral suppression for people living with HIV
The care continuum helps public health officials and policymakers better identify where gaps in services might exist and better support those living with HIV to achieve viral suppression. Supporting people with HIV to move through each step is critical as it prevents transmission and helps those living with HIV stay healthy, improve quality of life, and live longer.
Q: In December of 2011, CDC published the first nationwide continuum of HIV care. At that time, only 28% of the 1.1 million people who were estimated to be living with HIV in the United States were virally suppressed. How has the rate of viral suppression in the U.S. changed and what factors have led to improvements in viral suppression rates?
NB: In CDC’s latest report on HIV prevention progress, including national and state level data for 2010 through 2017, 63% of the estimated number of people living with HIV were virally suppressed in 2017. This is a significant increase from the 28% we saw in 2011 and I think there a couple of reasons for why that is different.
The first has to do with how the estimate was calculated in 2011.The 2011 estimate was the first national population-based measurement of viral suppression among people living with HIV and it was based on multiple data sources and methods. The methodologies behind the data varied state by state and in 2011 many states did not have full reporting of CD4 and viral load lab results, which is a key element to estimating the number of people living with HIV and those who are virally suppressed. Since then, we have seen lots of progress in completeness of data reporting across the U.S. and the methodology used to calculate the steps along the HIV care continuum.
The second has to do with our prevention and care approach, which was informed in great part by the National HIV/AIDS Strategy (NHAS), which was first released in 2010. This plan emphasized the importance of a coordinated HIV treatment and prevention response that focuses on achieving viral suppression to prevent transmission and improve people’s lives. I think over the years this plan really led to the implementation of novel approaches and brought in coordination and funding to achieve the NHAS goals.
Q: How does AIDSVu’s mapping of the HIV continuum at the city and ZIP code-level help researchers identify strategies for moving more individuals through the care continuum?
NB: I like to believe that data drives decisions and I’ve seen it happen many times. Data is an essential component of public health research and its focus on improving population health. To properly inform what interventions and resources are needed to effectively address this epidemic, it helps to understand the magnitude of the HIV epidemic and its characteristics. One example of this is the mapping of the HIV continuum at the city-level, which can provide data to help evaluate the impact of strategies used in different cities.
If certain cities are doing measurably better at achieving the care continuum indicators, there might be strategies other cities and regions might be able to implement themselves. Visualizing the successes of other cities can help us fight this epidemic on a more local scale. Mapping at the ZIP code-level is as close as an individual-level measure that you can get – which helps researchers and public health officials to identify gaps in care and then that can inform targeted scale-up of prevention and care service strategies that are designed to address specific local needs.
Dr. David Holland:
Q: AIDSVu’s continuum maps allow viewers to look at city-level HIV surveillance data by race/ethnicity, sex, and age. In Fulton County (one of the two counties that make up metro Atlanta), approximately 60% of individuals living with HIV are virally suppressed. How is Fulton County working to increase viral suppression, especially in subgroups that are disproportionately impacted by HIV, such as Black men who have sex with men (MSM)?
DH: The first thing to remember is that viral suppression is the end of the continuum. Strategies that encourage actions like medication adherence are important, but we also need to pay attention to steps earlier in the continuum. For example, making sure that people who are diagnosed with HIV understand their diagnosis and are properly linked to care services is a vital step. We know that once people leave care it is very difficult to get them back into care – so our best shot at getting people virally suppressed is to support linkage to care soon after their diagnosis.
Fulton County is working hard to make immediate linkage to care, specifically within the first 72 hours, the standard of care across our jurisdiction. We already improved our viral suppression rates. If you couple immediate linkage to care with comprehensive care services, you have a really good shot at getting people to be virally suppressed for long periods of time. To this end, we have developed special programs that target people that are at high risk of leaving the care continuum, in particular young Black men who have either mental health or substance use issues. In addition, we offer specific programs for those who are experiencing homelessness and other hardships. We try and cater our assistance programs to those individuals who are experiencing specific challenges and make sure these resources are helping them to overcome those challenges because that’s what ultimately makes a difference.
Those people who have left the care continuum are a different challenge because there’s usually other circumstances preventing them from continuing to seek care. It’s not just a matter of locating them and giving them an appointment – this has to be coupled with dialogue and intervention to help determine the underlying factors preventing them from seeking care. Again, this is all about ensuring the appropriate resources are there to help those in need. Currently, we’re working closely with various community groups and members of the community to help us figure out strategies to properly help those living with HIV overcome any of these barriers preventing them from reaching the end of that continuum.
Q: How does mapping the HIV continuum help local health departments to target interventions and work towards increasing the level of viral suppression in their jurisdiction?
DH: Mapping offers valuable insights for public health officials looking to know an area’s demographics and population distribution. For example, if we can see that a particular ZIP-code or census tract has a higher population of people living with HIV, then we know there needs to be adequate services close to them so they don’t have to go all the way across town. We want to make sure people are able to access health care services near them. This also goes for services beyond medical care, like substance abuse treatment facilities or housing assistance programs.
Health departments oftentimes fund service providers in the community, which means this data can help build coordinated care coalitions across different agencies to try to address the disparities observed on these maps.
Q: The Fulton County Board of Health has developed a “Blueprint for Ending HIV in Fulton County,” which calls for decreasing new HIV infections by 25% by 2023, getting 90% of people living with HIV to know their status, 90% retained in care, and 50% of those with indications for PrEP to be on PrEP. How were those goals set and how is Fulton County working towards those goals?
DH: This has been a long planning process that started back in 2015 with the Fulton County Task Force for HIV/AIDS, which developed a strategy document that included over 60 different targets for moving Fulton County towards HIV elimination. A lot of our goals in the Blueprint for Ending HIV in Fulton County were taken from the strategy originally developed by a broad coalition of academics, community groups, and members of the public health community.
However, with all of the End the HIV Epidemic (EHE) initiatives coming out at the federal, state and local levels, our blueprint has begun to transform into a broader metro-Atlanta wide strategy, which includes the four nearby counties that are set to receive federal grant money to begin their EHE plans.


