In addition to the new HIV care continuum data, AIDSVu also released updated 2018 ZIP Code-level HIV prevalence and new diagnosis data and interactive maps. AIDSVu is excited to add more than 10 new cities this year, bringing the total number of cities mapped at the ZIP Code-level to more than 50. Over 45 of these cities were updated to 2018 data today and more will follow throughout the summer as those data become available.
In collaboration with health departments across the country, AIDSVu is now visualizing steps of the HIV care continuum, including new diagnoses, late diagnoses, linkage to care, receipt of care, and viral suppression, alongside 2018 ZIP Code-level HIV prevalence data and interactive maps. These interactive maps can be viewed across different demographic groups such as age, sex, and race/ethnicity, as well as alongside social determinants of health and overlaid with HIV testing, PrEP, and care service locations.
“By visualizing ZIP Code-level data across the HIV care continuum, health departments, policymakers, researchers, and community leaders are better able to identify disparities in outcomes – especially among racial and ethnic minorities who often experience the greatest health disparities–, develop programs, and allocate resources to achieve the goal of viral suppression. I thank the health departments that shared their data with AIDSVu and made it possible to standardize and visualize these data across the cities for the first time,” said Patrick Sullivan, DVM, PhD, Professor of Epidemiology at Emory University’s Rollins School of Public Health and Principal Scientist for AIDSVu. “We will continue to work with additional cities in the coming months to bring more ZIP Code-level continuum data and maps to AIDSVu, further empowering communities to understand and visualize their local HIV epidemics.”
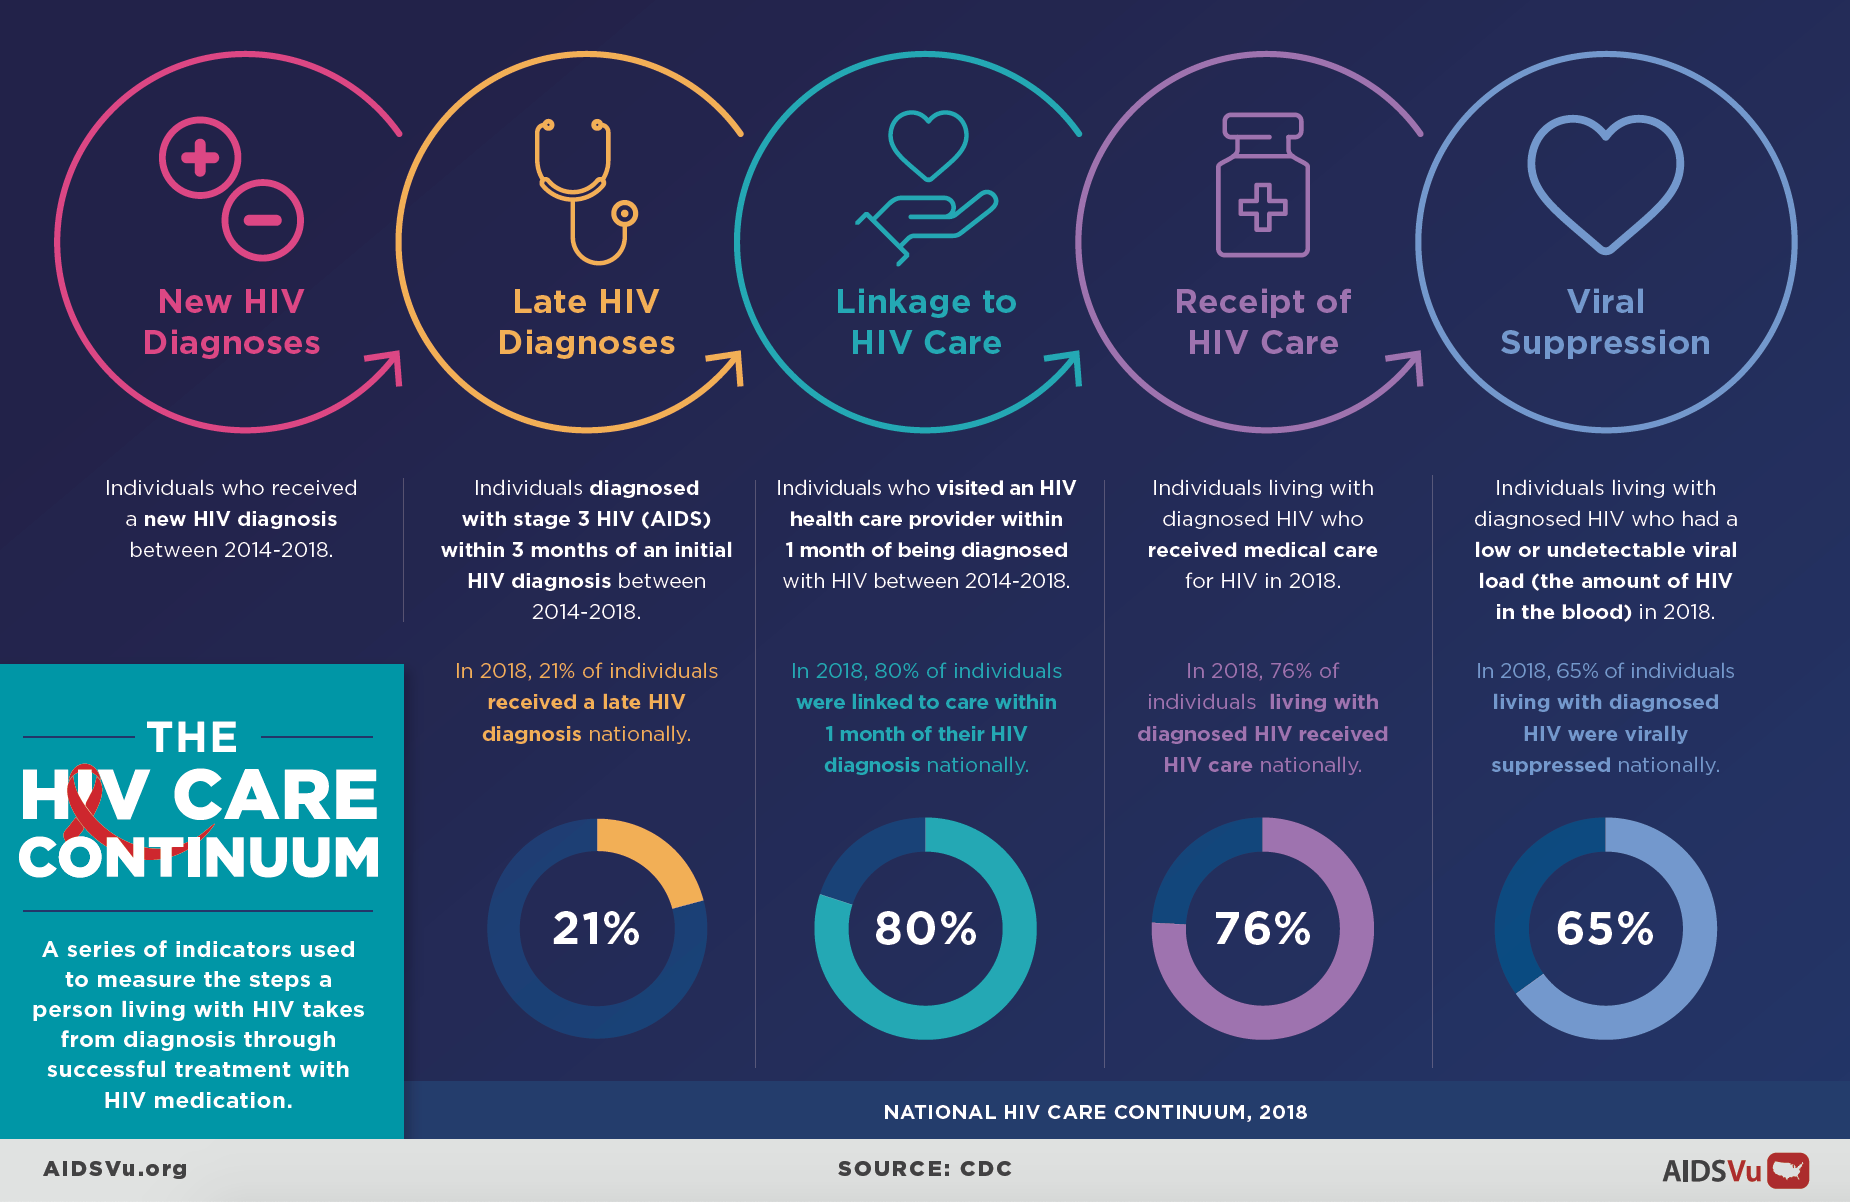
The HIV care continuum is a public health model that outlines the stages of care that people living with HIV go through from diagnosis to achieving and maintaining viral suppression – a very low or undetectable amount of HIV in the body. Once an individual is virally suppressed to the point where HIV cannot be detected in their blood, they effectively cannot transmit HIV. This is the foundational concept of Undetectable = Untransmittable, or U = U.
The HIV care continuum is vital in assessing individual care outcomes and population-level impact and helps determine if people living with HIV in a given community are engaged in each successive step. This helps policymakers and service providers better determine where resources and strategies are needed to support people living with HIV to achieve the goal of viral suppression. AIDSVu has also added a new Deeper Look: Viral Suppression page to provide further understanding of the final HIV care continuum step and insights from these data.
AIDSVu maps the following steps of the care continuum down to the ZIP Code-level:
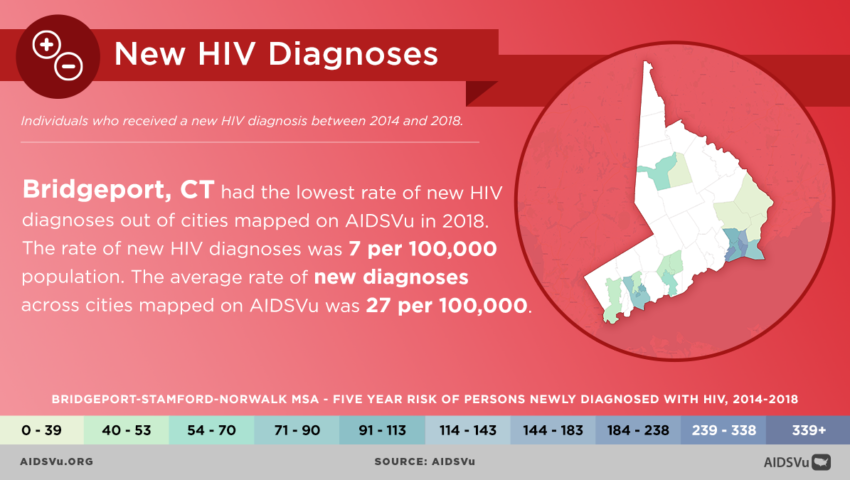
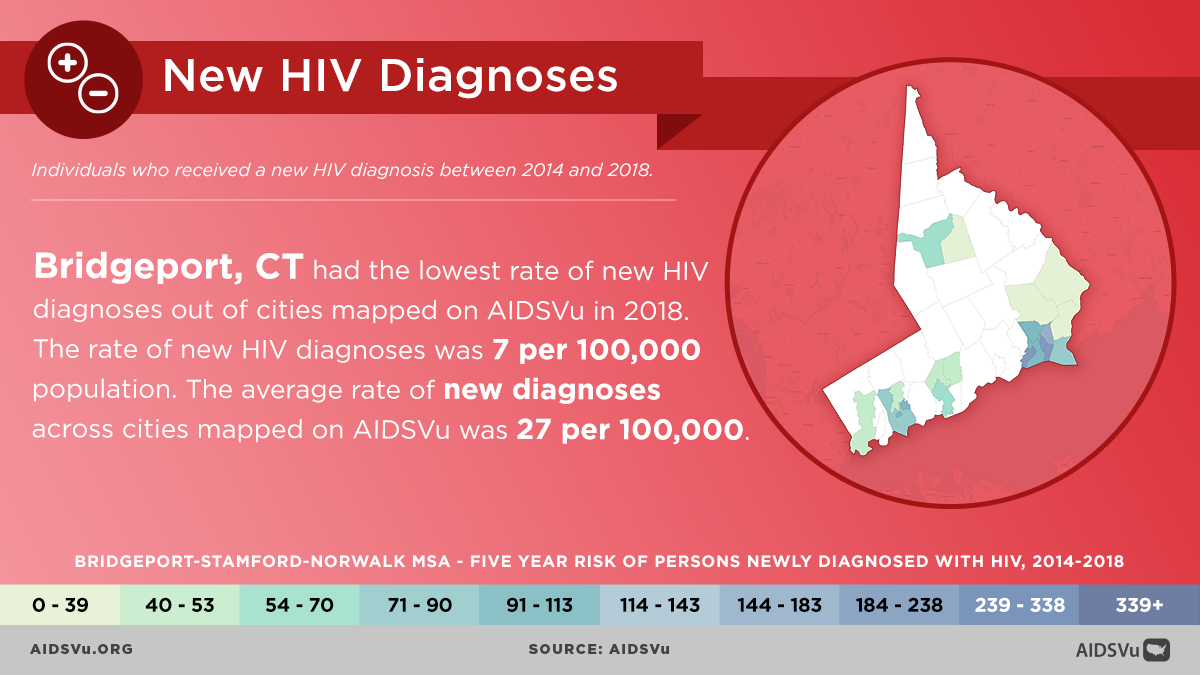
- New HIV Diagnoses – Individuals who received a new HIV diagnosis between 2014 and 2018.
- Late HIV Diagnoses – Individuals diagnosed with stage 3 HIV (AIDS) within 3 months of an initial HIV diagnoses between 2014 and 2018.
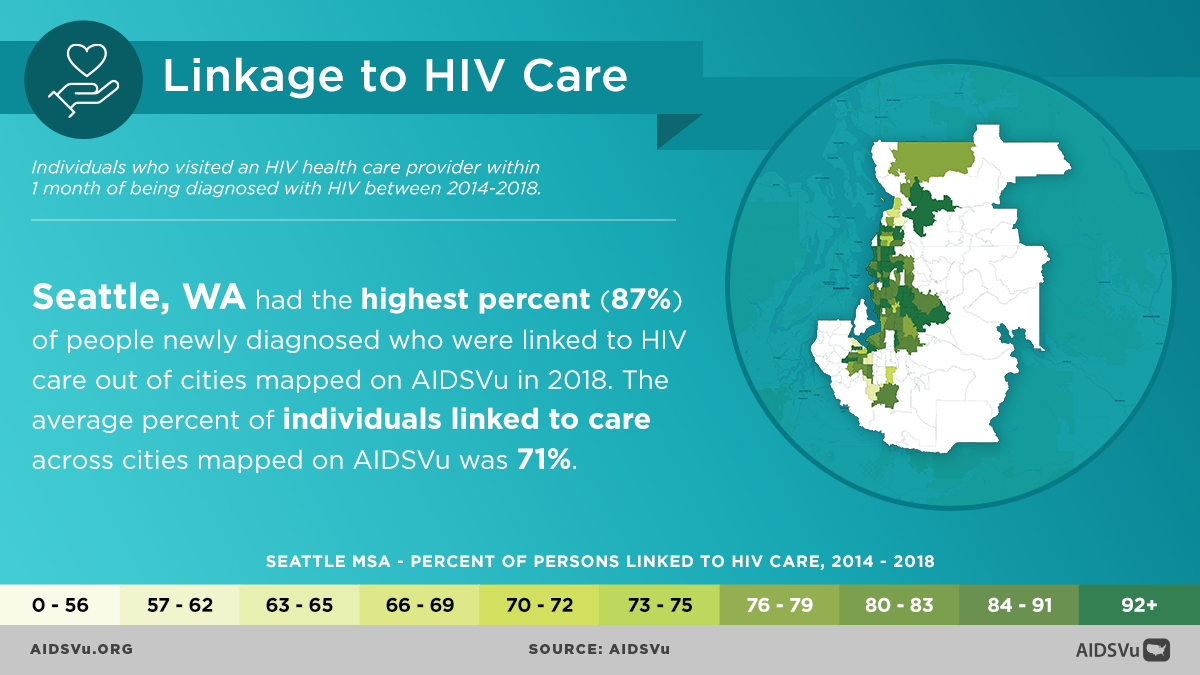
- Linkage to HIV Care – Individuals who visited an HIV health care provider within 1 month of being diagnosed with HIV between 2014-2018.
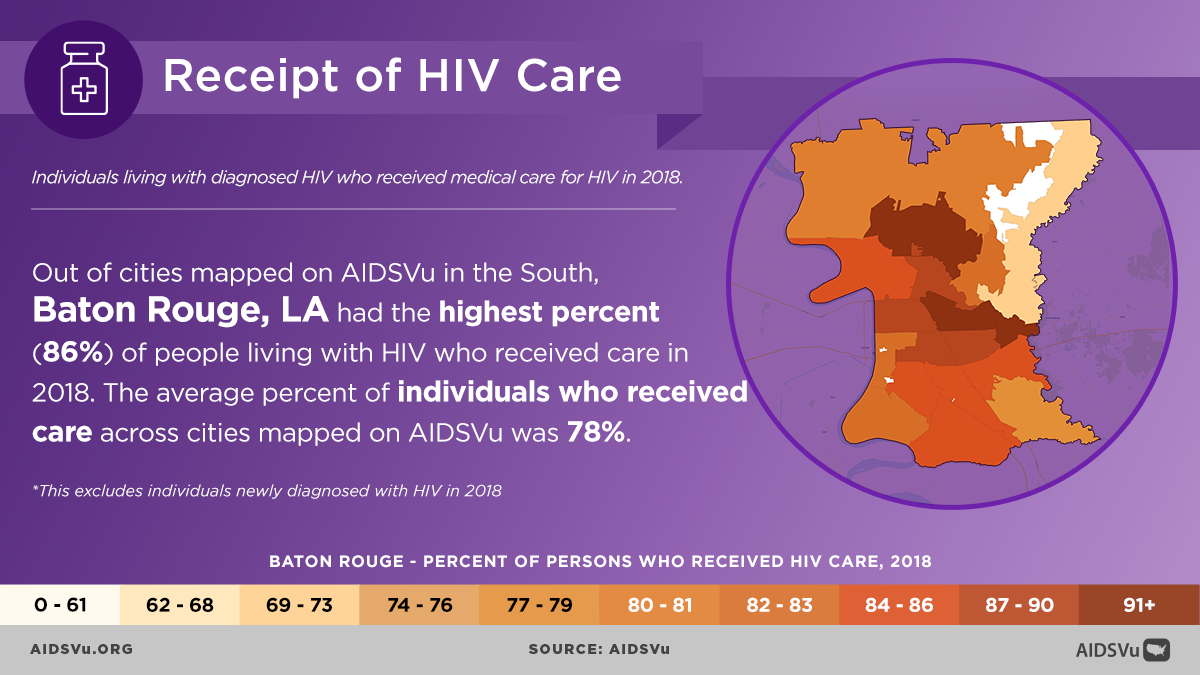
- Receipt of HIV Care – Individuals living with diagnosed HIV who received medical care for HIV in 2018.
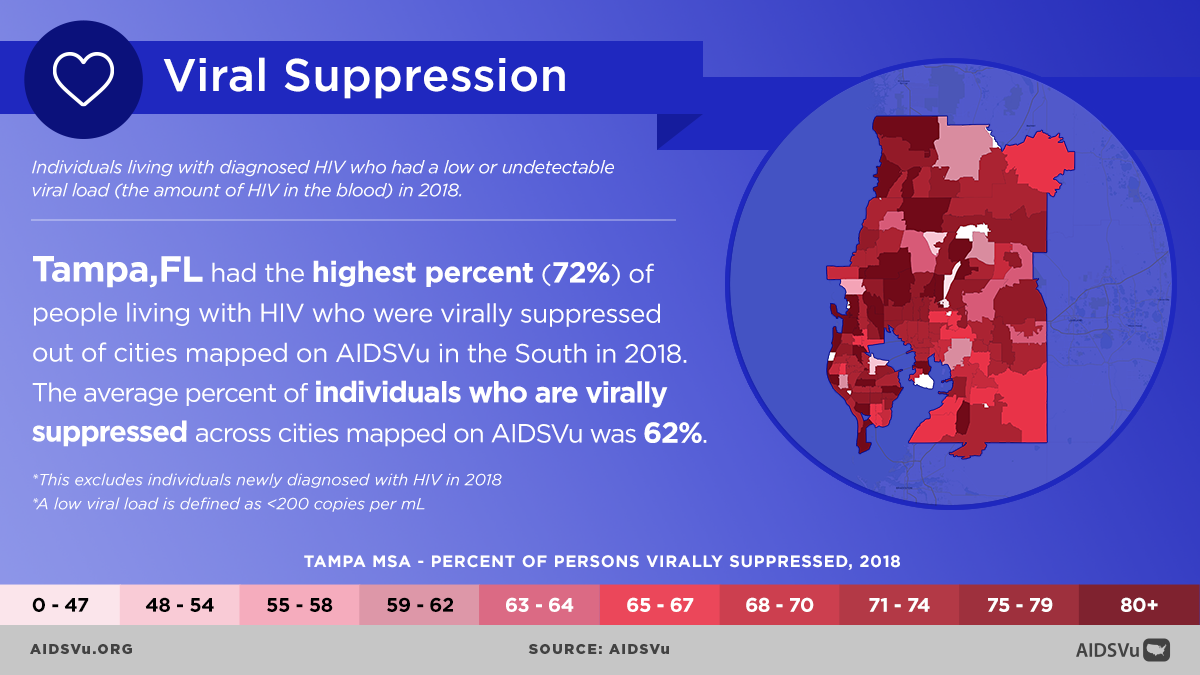
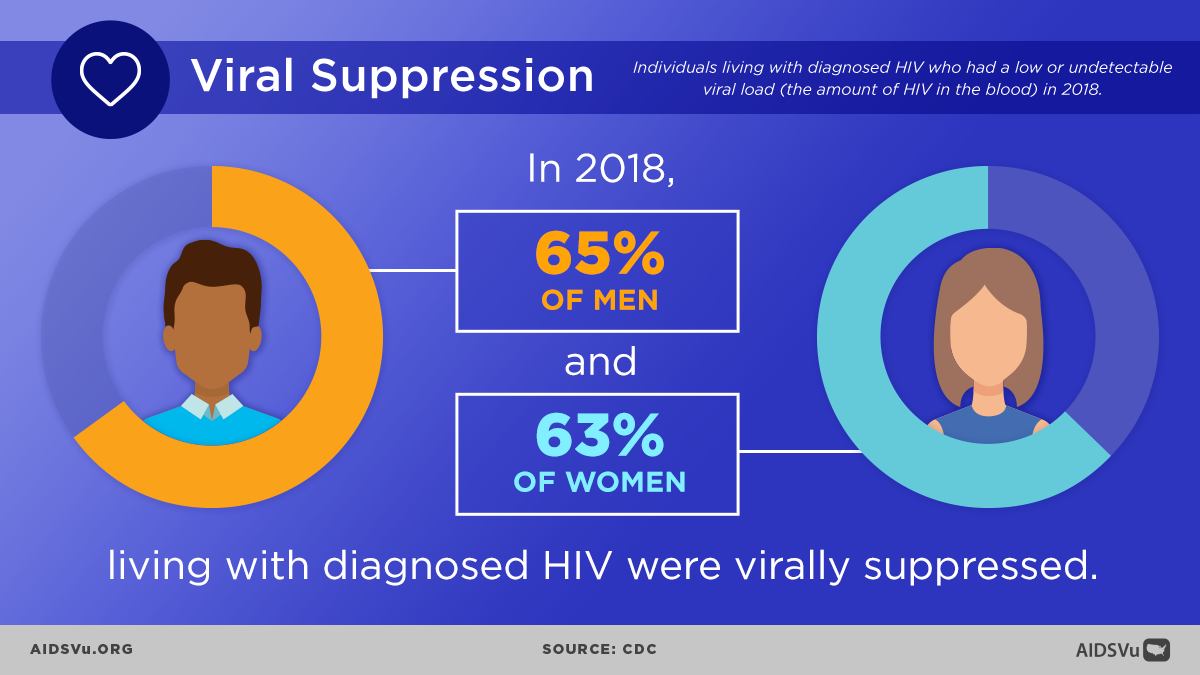
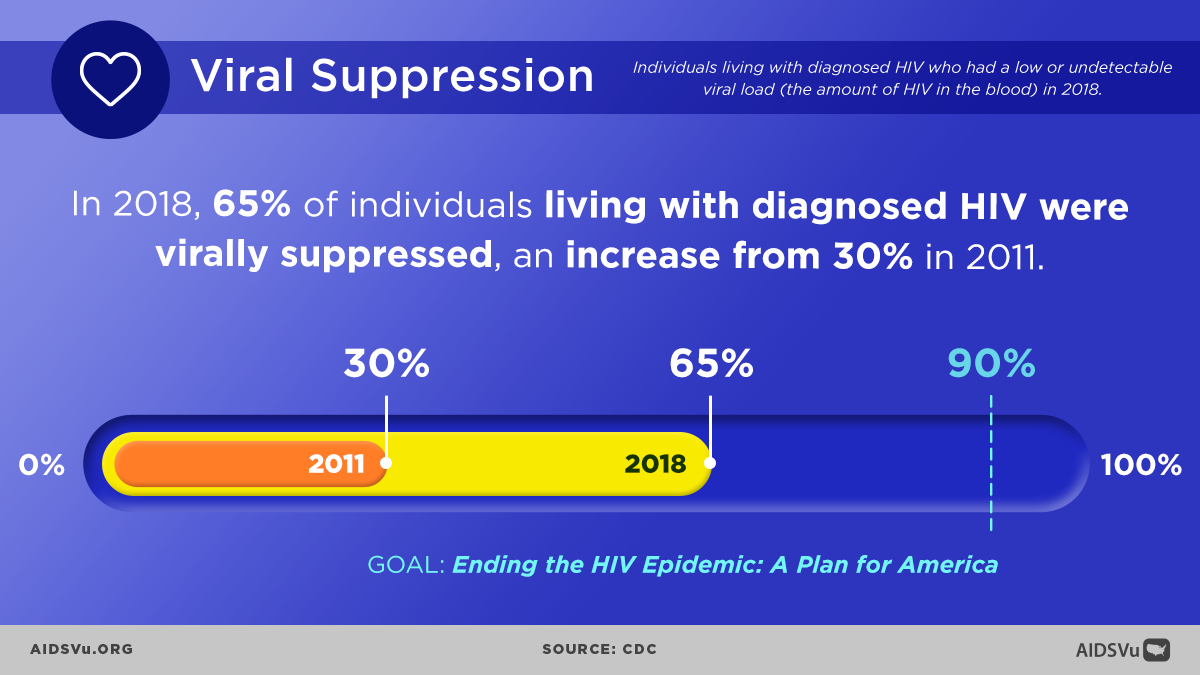
- Viral Suppression – Individuals living with diagnosed HIV who had a low or undetectable viral load (the amount of HIV in the blood) in 2018.
For full indicator definitions, please see the Data Methods.
These data and maps began as a proof of concept with the inaugural Powered By AIDSVu project HIVContinuum.org in February 2015, and now AIDSVu is expanding on this model and adding the data to the AIDSVu site.
Major city-level data updates this year include:
- ZIP Code-level maps showing HIV prevalence (2018) and new diagnoses data (cumulative 2014 to 2018) for more than 50 U.S. cities.
- This includes more than 10 new cities, including Charleston, SC; Cincinnati, OH; Cleveland, OH; Columbus, OH; Fort Worth, TX; Minneapolis, MN; Mobile, AL; Montgomery, AL; Phoenix, AZ; Providence, RI; San Antonio, TX; and St. Louis, MO, nearly all of which are to reach jurisdictions prioritized for Phase 1 of Ending the HIV Epidemic: A Plan for America, a ten-year initiative to end the HIV epidemic in the U.S.
- ZIP Code-level maps showing late HIV diagnoses (cumulative 2014 to 2018), linked to HIV care (cumulative 2014 to 2018), receipt of HIV care (2018), and viral HIV suppression (2018) for more than 35 U.S. cities.
- Enhanced city data profile pages, including HIV care continuum data, for more than 45 U.S. cities that are easy to download and print.
- New Deeper Look page on viral suppression to highlight the importance of the final HIV care continuum step and share insights from the data.
- City-level HIV maps alongside maps of social determinants of health – such as poverty, high school education, median household income, income inequality, and people without health insurance.
About AIDSVu’s Annual City Data Update
AIDSVu is presented by Emory University’s Rollins School of Public Health in partnership with Gilead Sciences, Inc. and the Center for AIDS Research at Emory University (CFAR). Now in its tenth year, AIDSVu continues to advance its mission to make HIV data widely available, easily accessible, and locally relevant to inform public health decision making. The site aims to provide researchers, policymakers, and community members with a more comprehensive understanding of the HIV epidemic at the local-, state-, and national- level.
ZIP Code, census tract, and community area/ward data were provided by state and city health departments and compiled by researchers at the Rollins School of Public Health. Learn more about AIDSVu’s HIV care continuum data and sources, see our FAQ and Data Methods.

