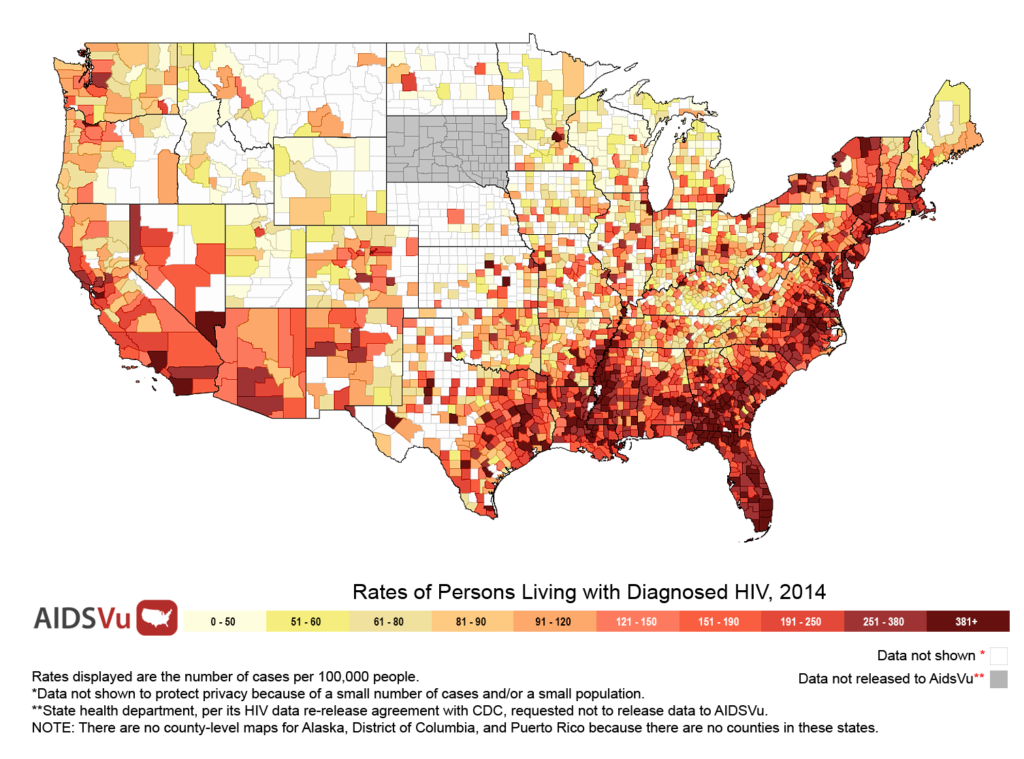
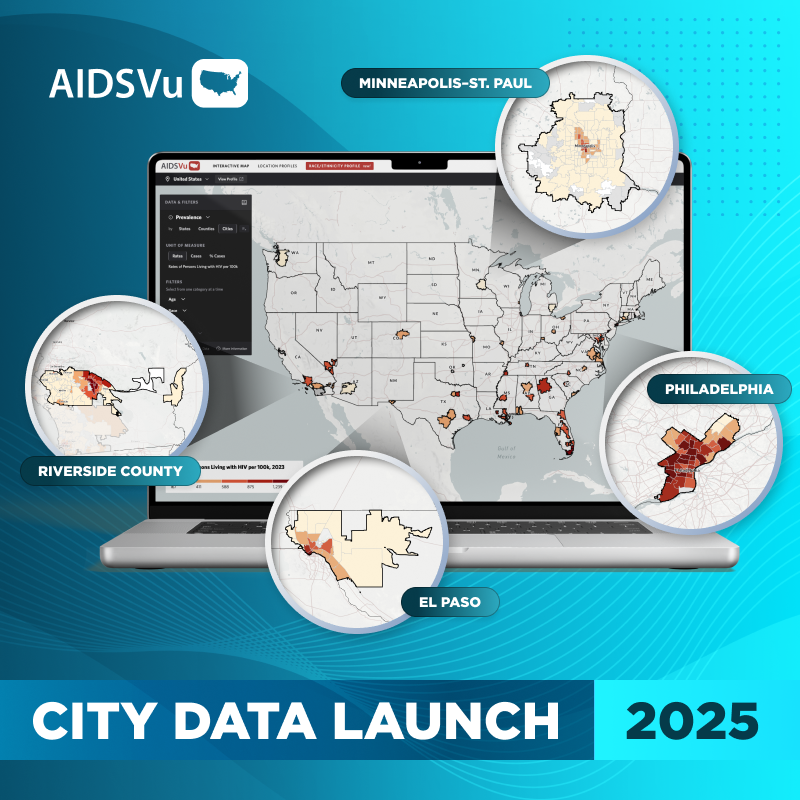
Today, AIDSVu is excited to release new interactive maps that visualize the impact of HIV across the United States, revealing that two-thirds of all new HIV diagnoses in 2015 occurred in two-and-a-half percent of U.S. counties. Using the latest publicly available data at the city-, county-, and state-levels, these new maps illustrate disparities in HIV infections and mortality, both geographically and across different demographic groups.

The new maps highlight some striking trends:
- Southern States Experience the Greatest Burden of Infection and Deaths: The Southern U.S. is home to nearly 37 percent of the country’s population, but these states account for more than half of all new HIV diagnoses (52 percent) and deaths (49 percent) among persons diagnosed with HIV. Furthermore, the five U.S. cities with the highest rates of new HIV diagnoses (Miami, FL; Jackson, MS; New Orleans, LA; Baton Rouge, LA; and Atlanta, GA) are all located in the South.
- Racial Disparities in HIV Infection Continue with African Americans Most Impacted: While making up just 12 percent of the U.S. population, African American persons accounted for 45 percent of all new HIV diagnoses in 2015.
- HIV Diagnoses Among Youth Continue to Rise: While the number of new HIV diagnoses among all persons in the U.S. decreased by 18 percent between 2008 and 2015, new diagnoses among youth (aged 13 to 24) increased by 2 percent.
AIDSVu illustrates that where you live matters when it comes to being at risk for HIV infection. This year’s maps tell the story of the long-term disproportionate impact of HIV in the Southern U.S., as well as areas of the country where new patterns of HIV transmission are emerging, including Scott County, Indiana, where an HIV outbreak related to opioid and injection drug abuse resulted in over 150 individuals becoming infected with HIV in 2014 to 2015.
Now in its seventh year, AIDSVu is continually expanding the data and resources available on the site to give researchers, policymakers, and others the most comprehensive understanding of the HIV epidemic at the local, state, and national level. Visit “How Do You AIDSVu” to see how other organizations have utilized AIDSVu in their work, and check out our “Resources” page for downloadable maps, infographics, data sets, and other materials.
This year’s main updates to the website include:
- State- and county-level data showing HIV prevalence (2014), and new HIV diagnoses (year-over-year for 2008 to 2015).
- Mortality data at the state level, showing rates and number of deaths that occurred in 2014 among people with diagnosed HIV.
- ZIP code-level HIV prevalence (2015) and new HIV diagnoses (cumulative 2011 to 2015) maps for 41 U.S. cities representing more than 60 percent of the U.S. HIV epidemic. This year, AIDSVu added ZIP code-level data for one additional city: Seattle, WA.
- HIV PrEP (Pre-Exposure Prophylaxis) locator, which is a national directory of U.S. providers of comprehensive prevention services (including Truvada for PrEP™) developed by Emory University’s Rollins School of Public Health with support from M•A•C AIDS Fund.
- Data for the estimated number of transgender people living with diagnosed (2014) for 30 cities.


