
AIDSVu released its annual update of interactive maps and data visualizations, highlighting the latest national, state, and local insights into the HIV epidemic. The 2024 HIV surveillance data updates include state- and county-level figures on new diagnoses, prevalence, mortality, and care outcomes, offering essential tools for policymakers, researchers, and community leaders committed to ending the HIV epidemic in the U.S.
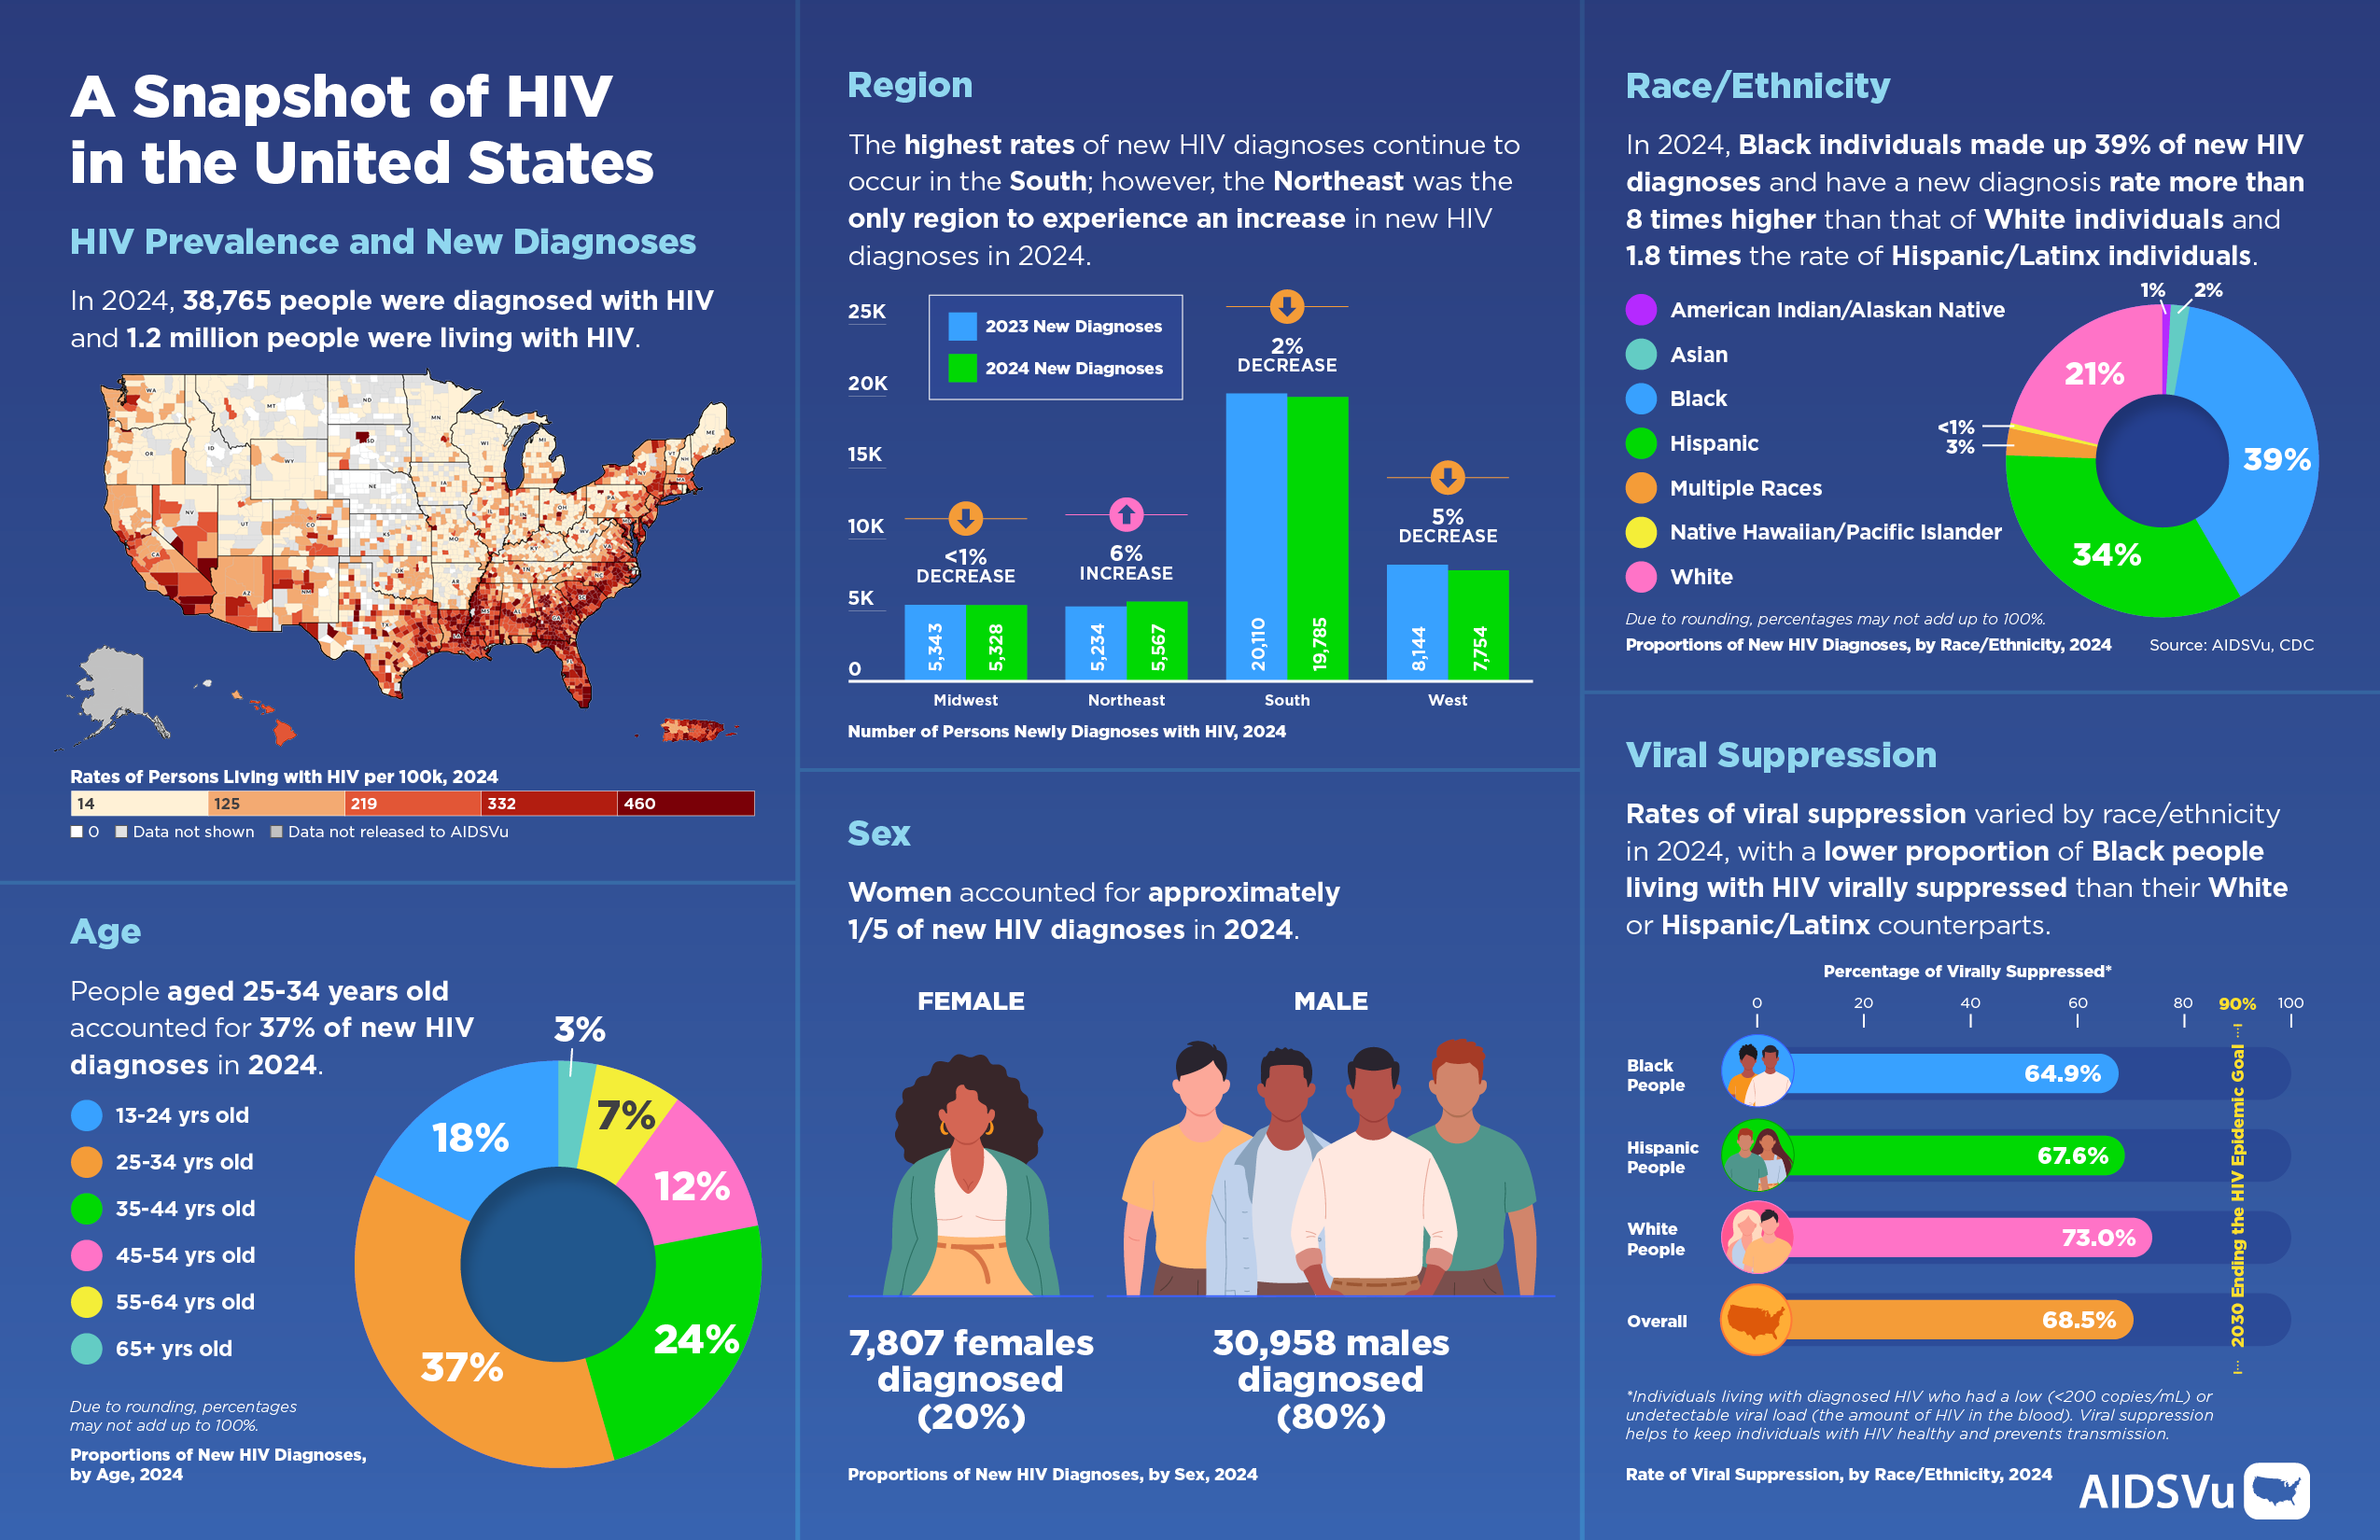
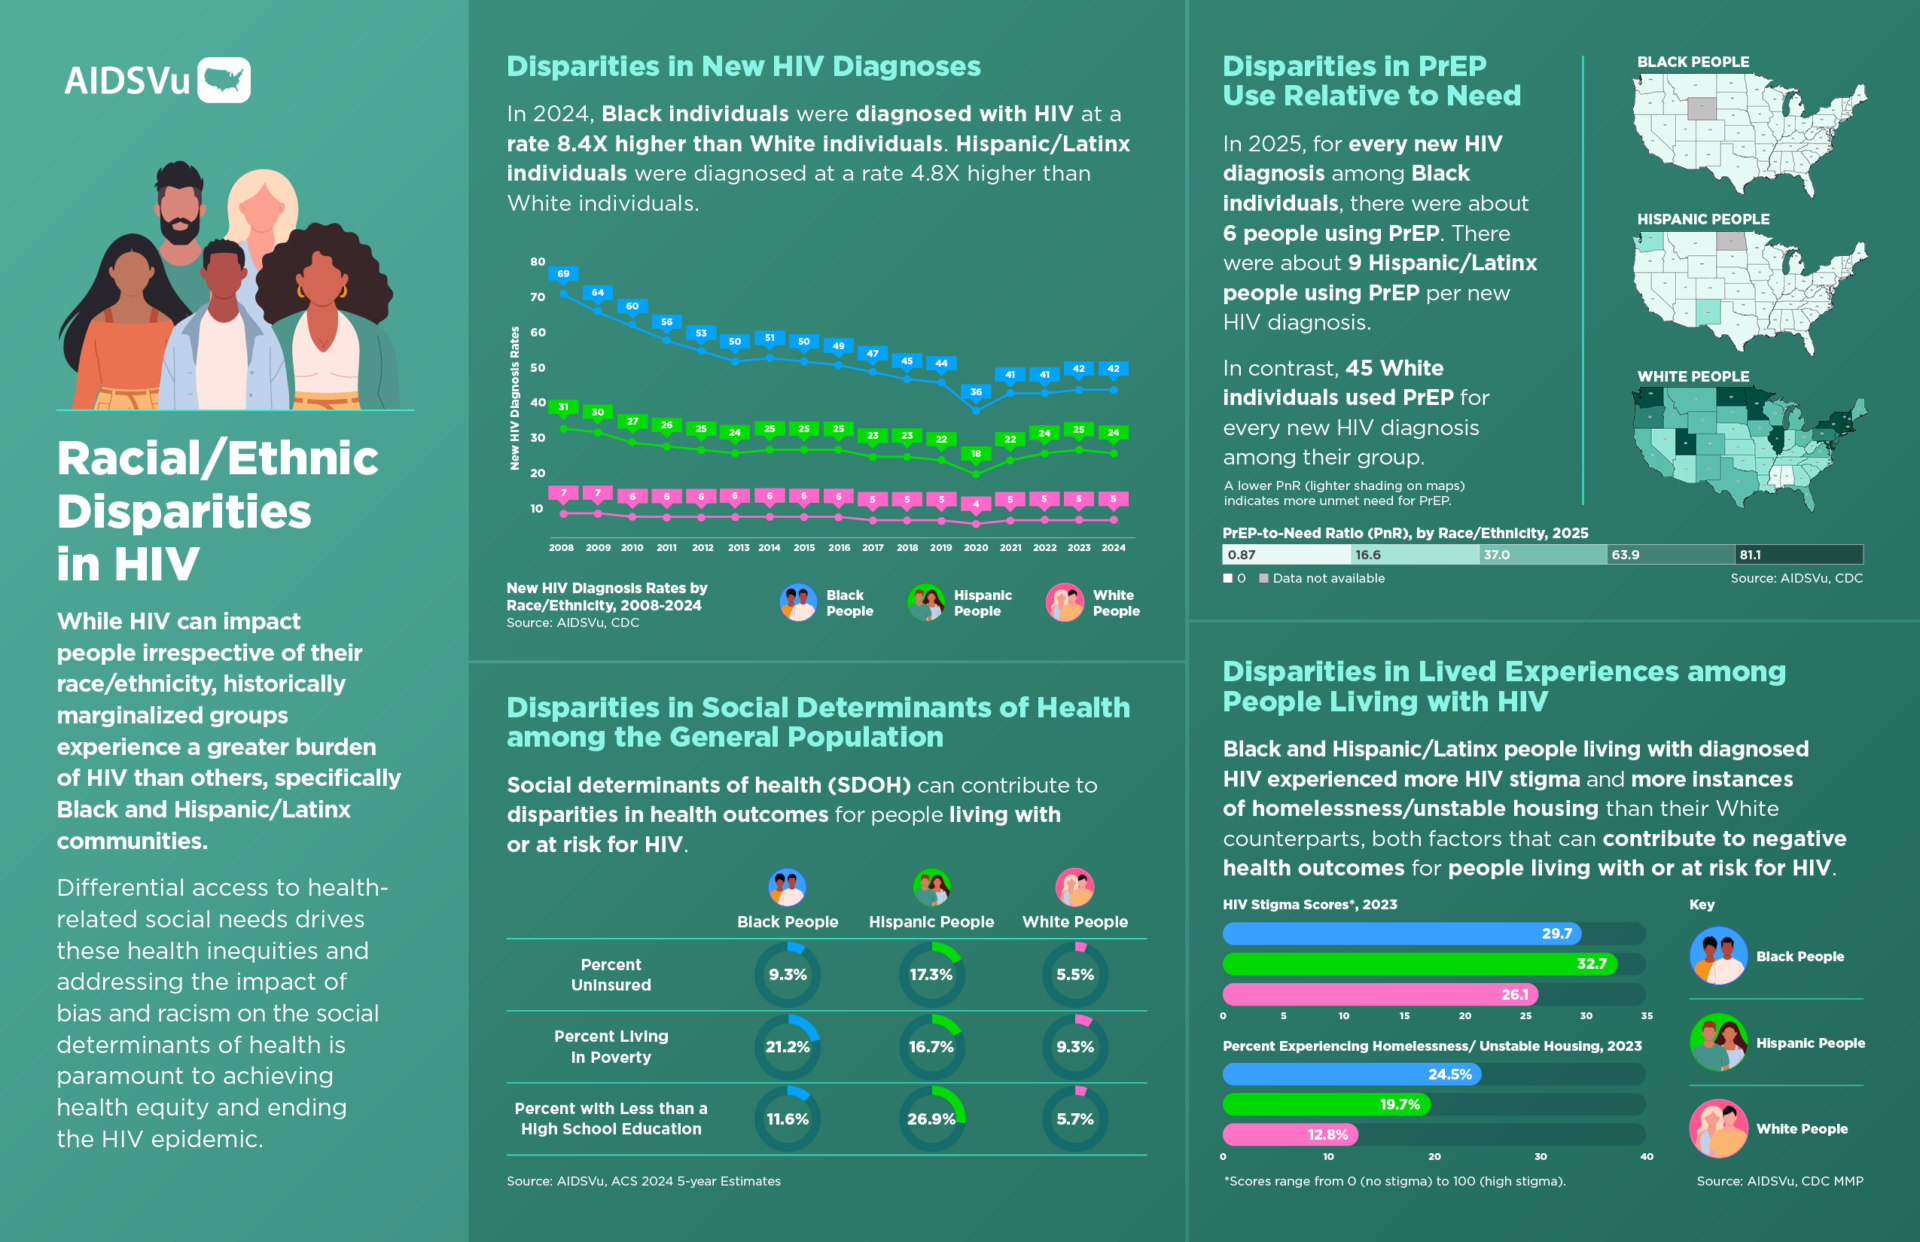
In 2024, there were 38,765 new HIV diagnoses, marking an 18% decline since 2008, although only a 1% decrease from 2023. Yet disparities persist—Black individuals accounted for 39% of new diagnoses, facing rates more than 8× higher than White individuals (42 vs. 5 new HIV diagnoses per 100,000 population). Hispanic/Latino individuals faced rates nearly 5× higher (24 per 100,000) than White individuals.
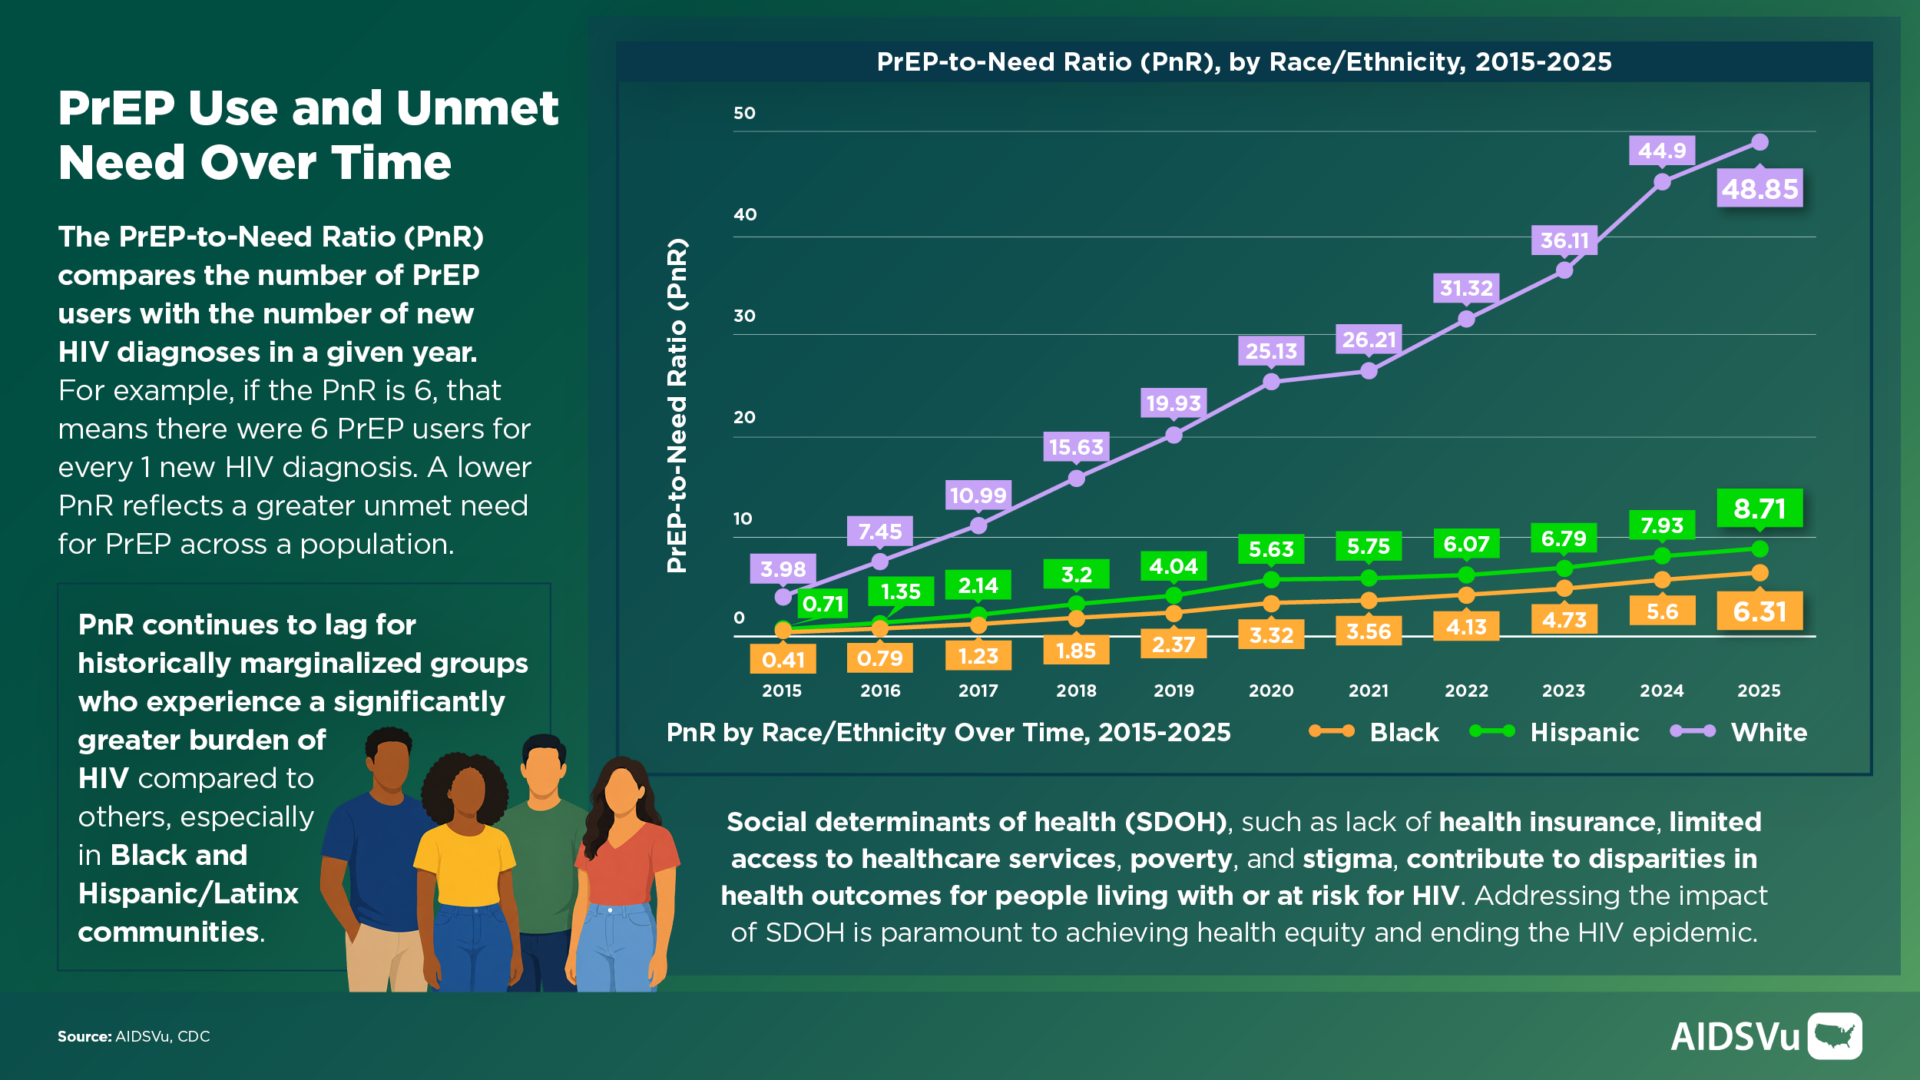
This year’s data show measurable progress, but the same data show how unevenly that progress is shared: Black and Hispanic/Latino communities, the South, and young people continue to carry a disproportionate share of the epidemic, and the gap between HIV prevention need and PrEP use remains widest exactly where the burden is greatest.
Annual Launch 2026
Explore our Resources
AIDSVu’s infographics are designed to highlight national progress in ending the HIV epidemic in the U.S. Share them on social media, print them as one-pagers, or incorporate them into presentations to help raise awareness about HIV prevention, trends, and the care continuum.
Snapshot of HIV
Racial Disparities
PrEP Use
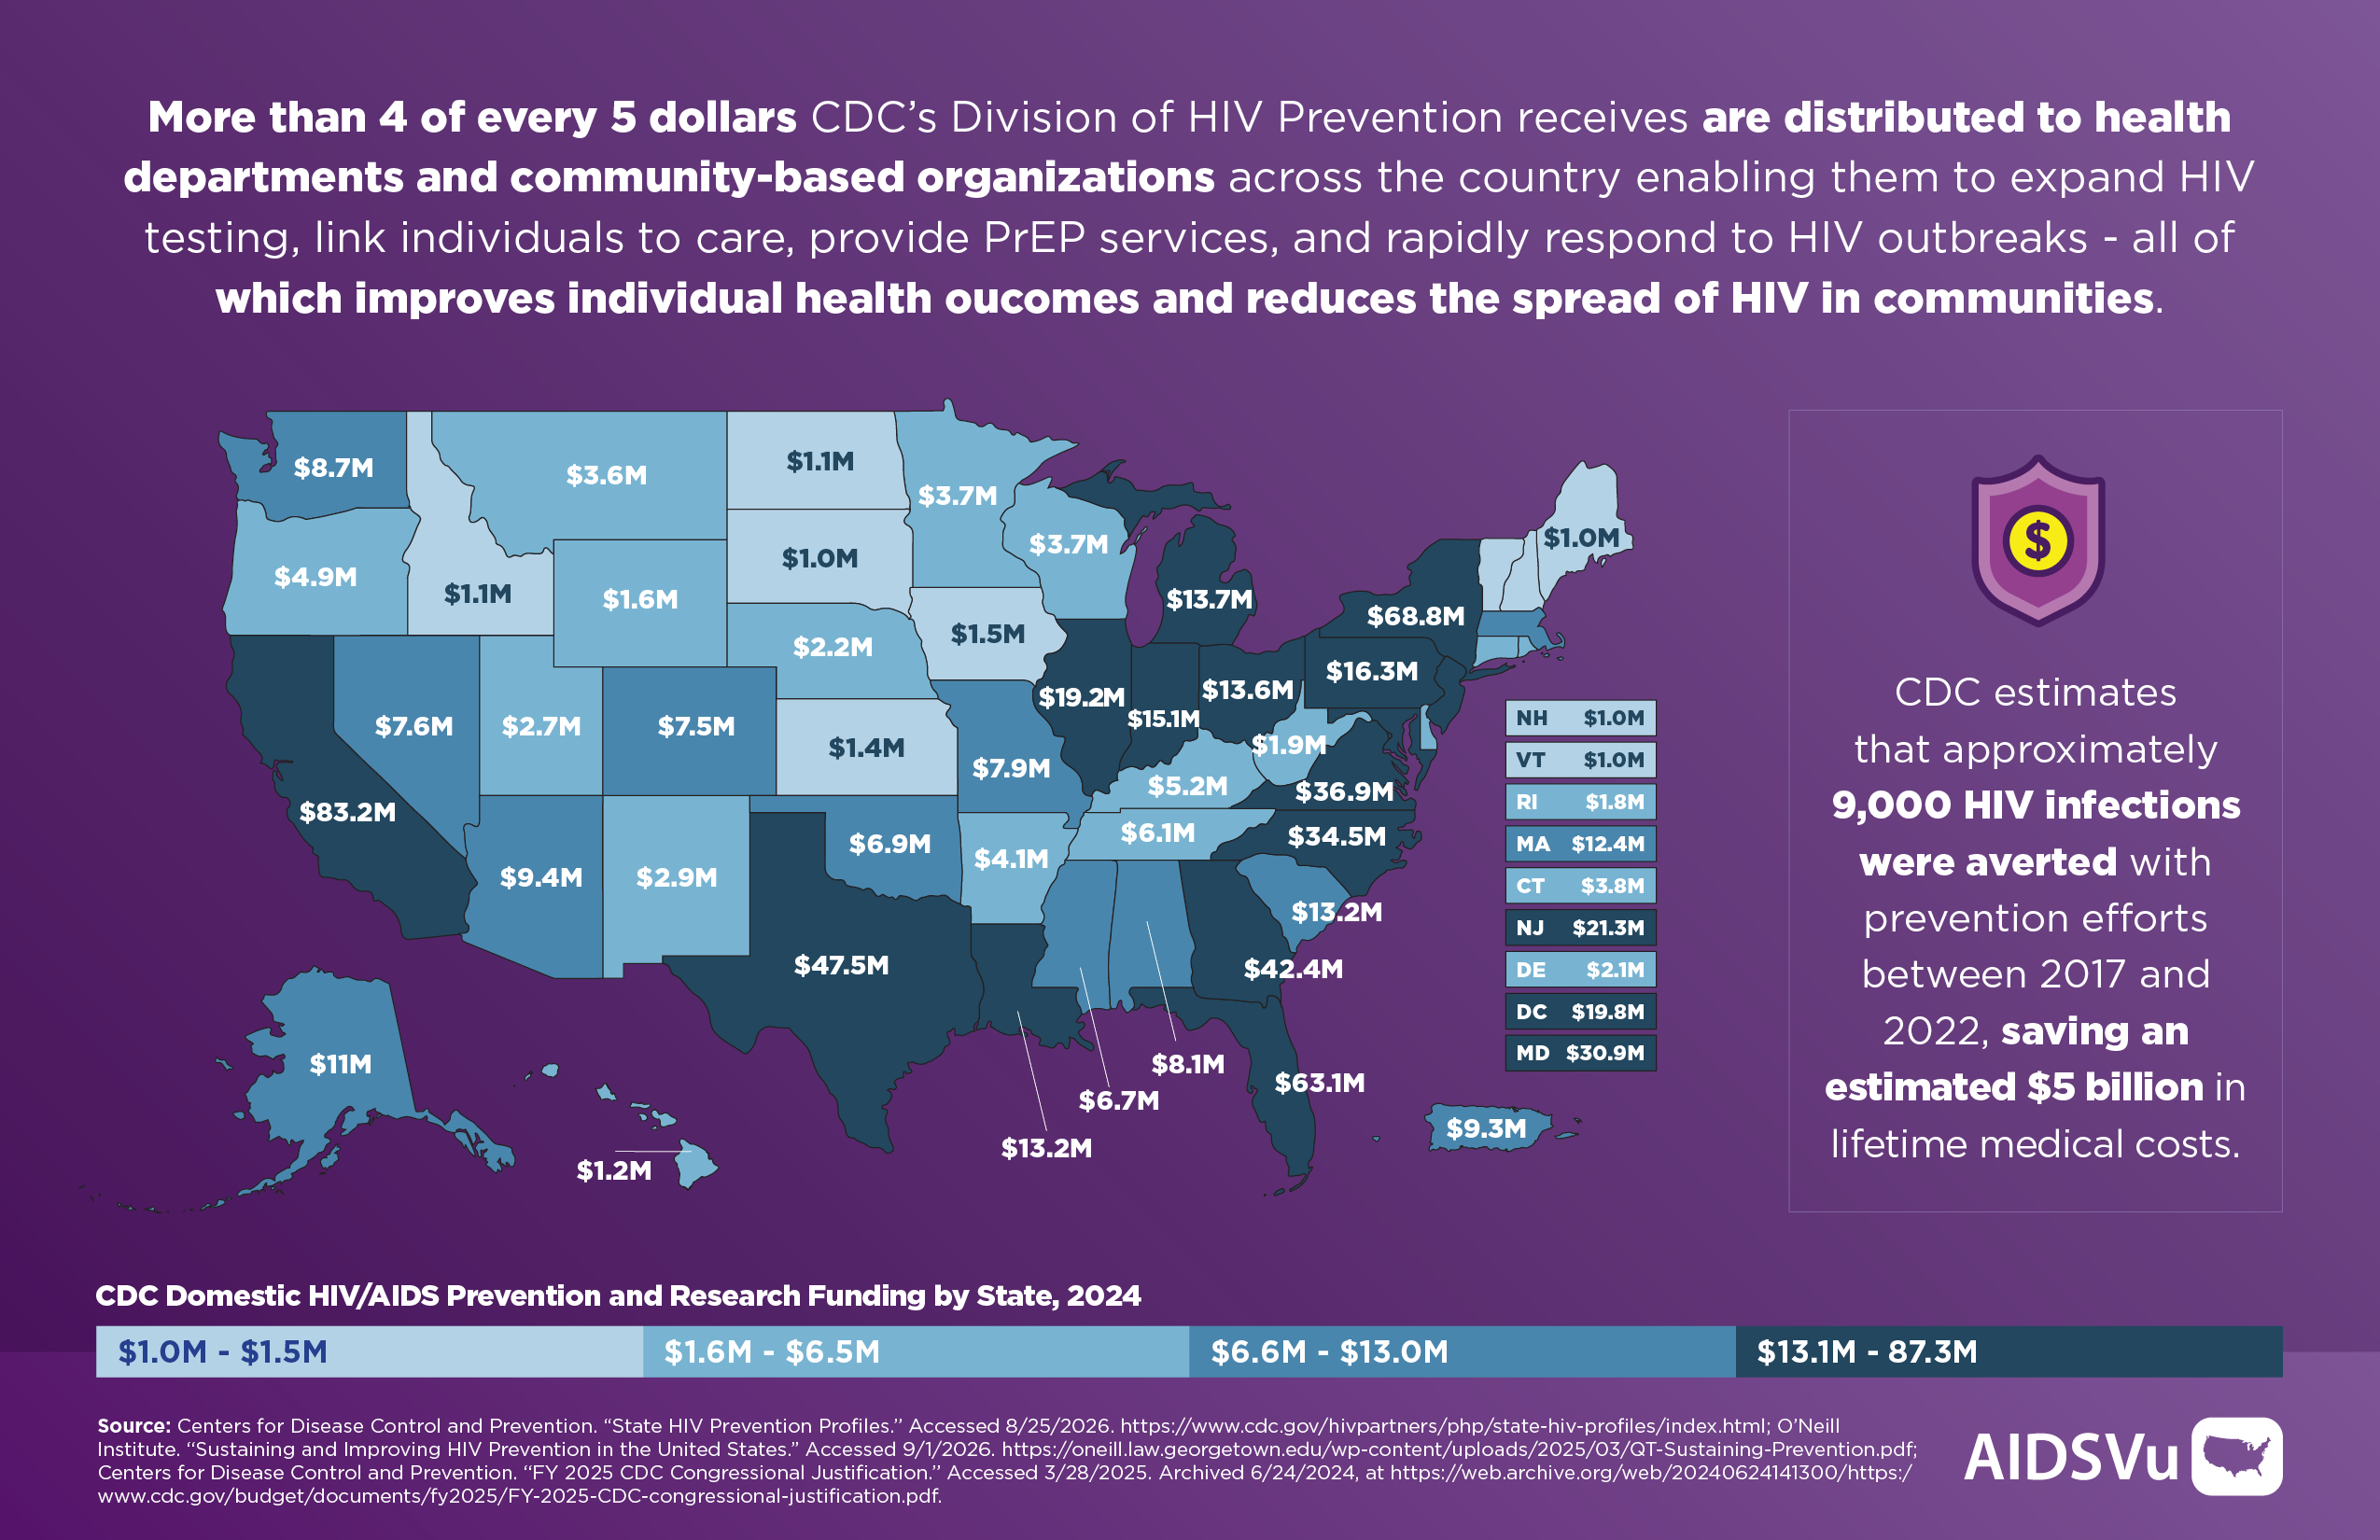
HIV CDC Funding
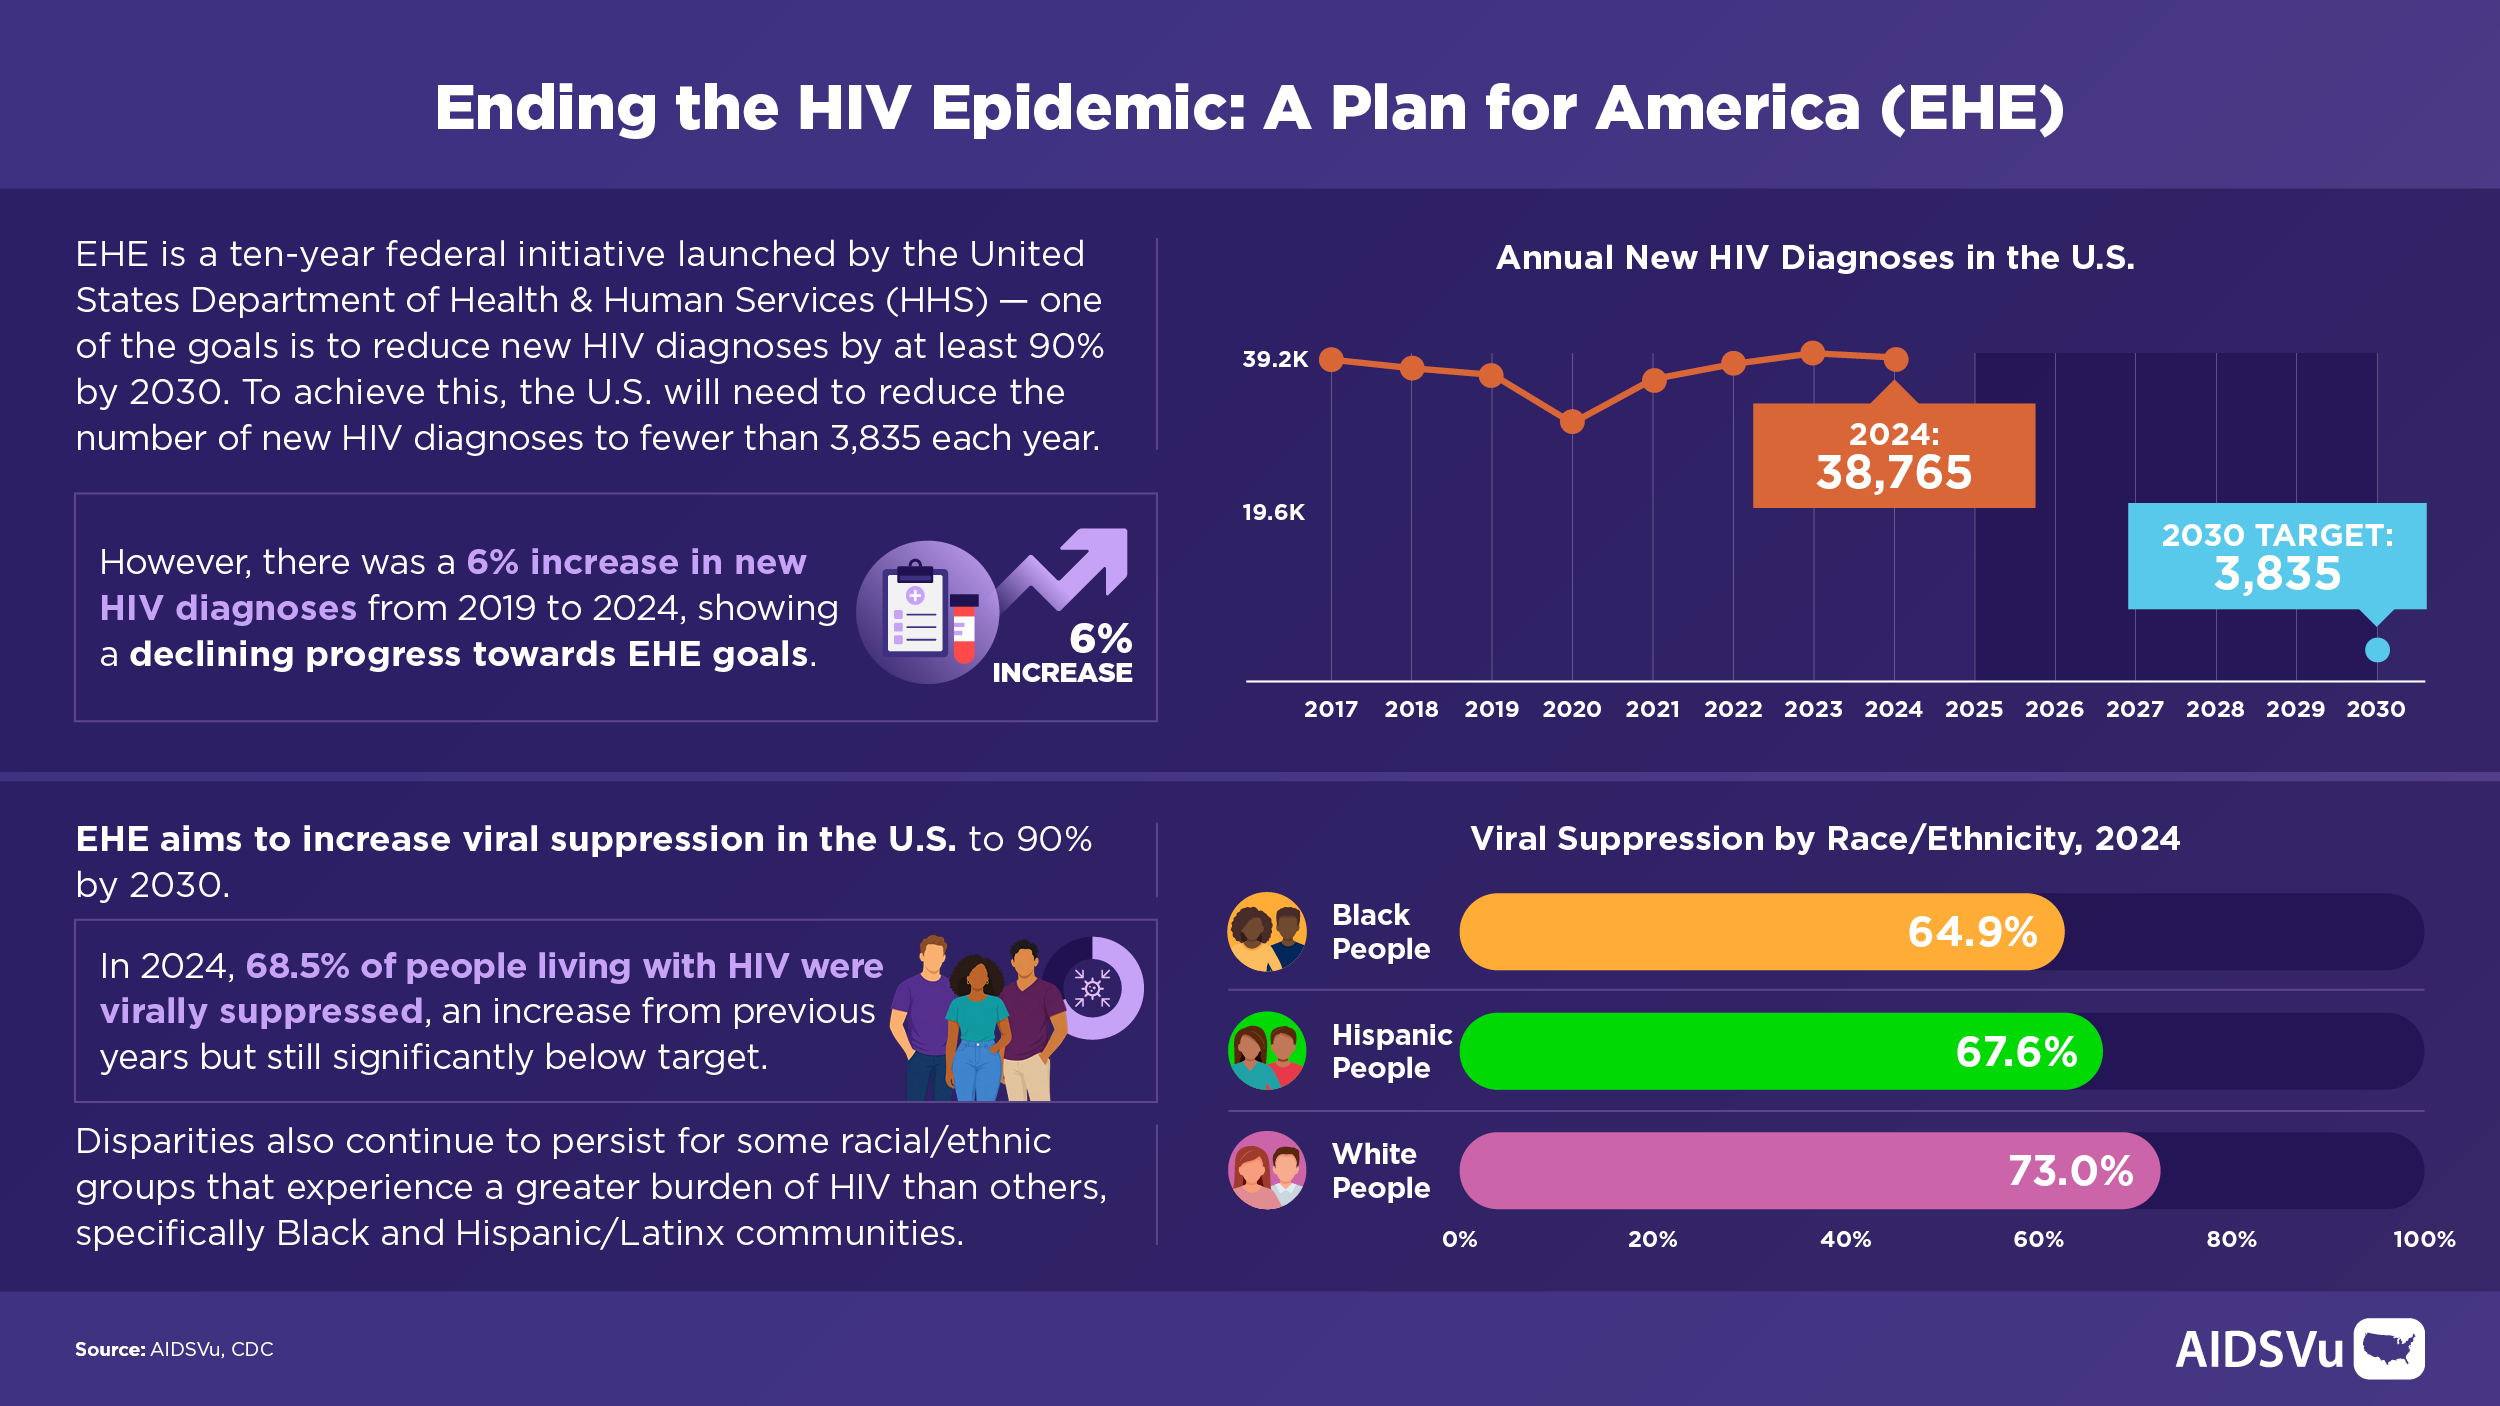
Ending the HIV Epidemic
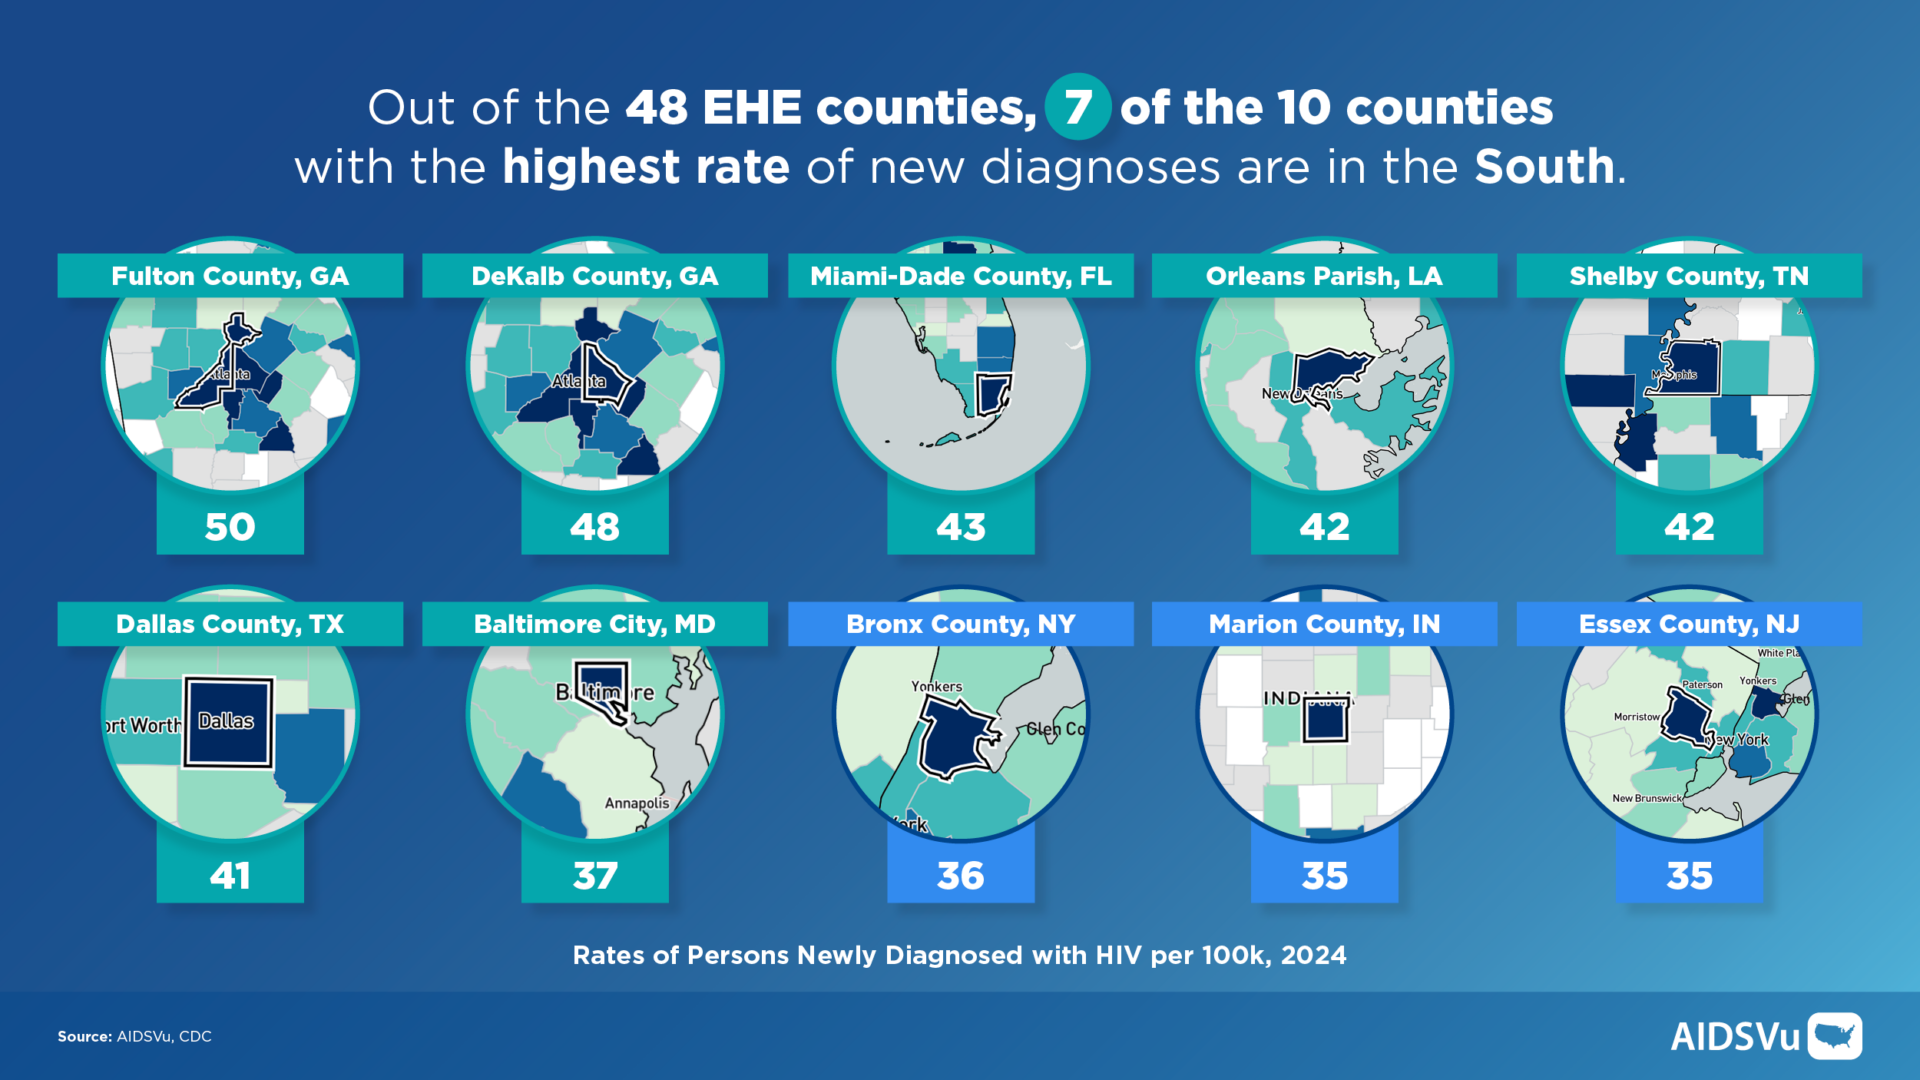
Rate of Newly Diagnosed with HIV
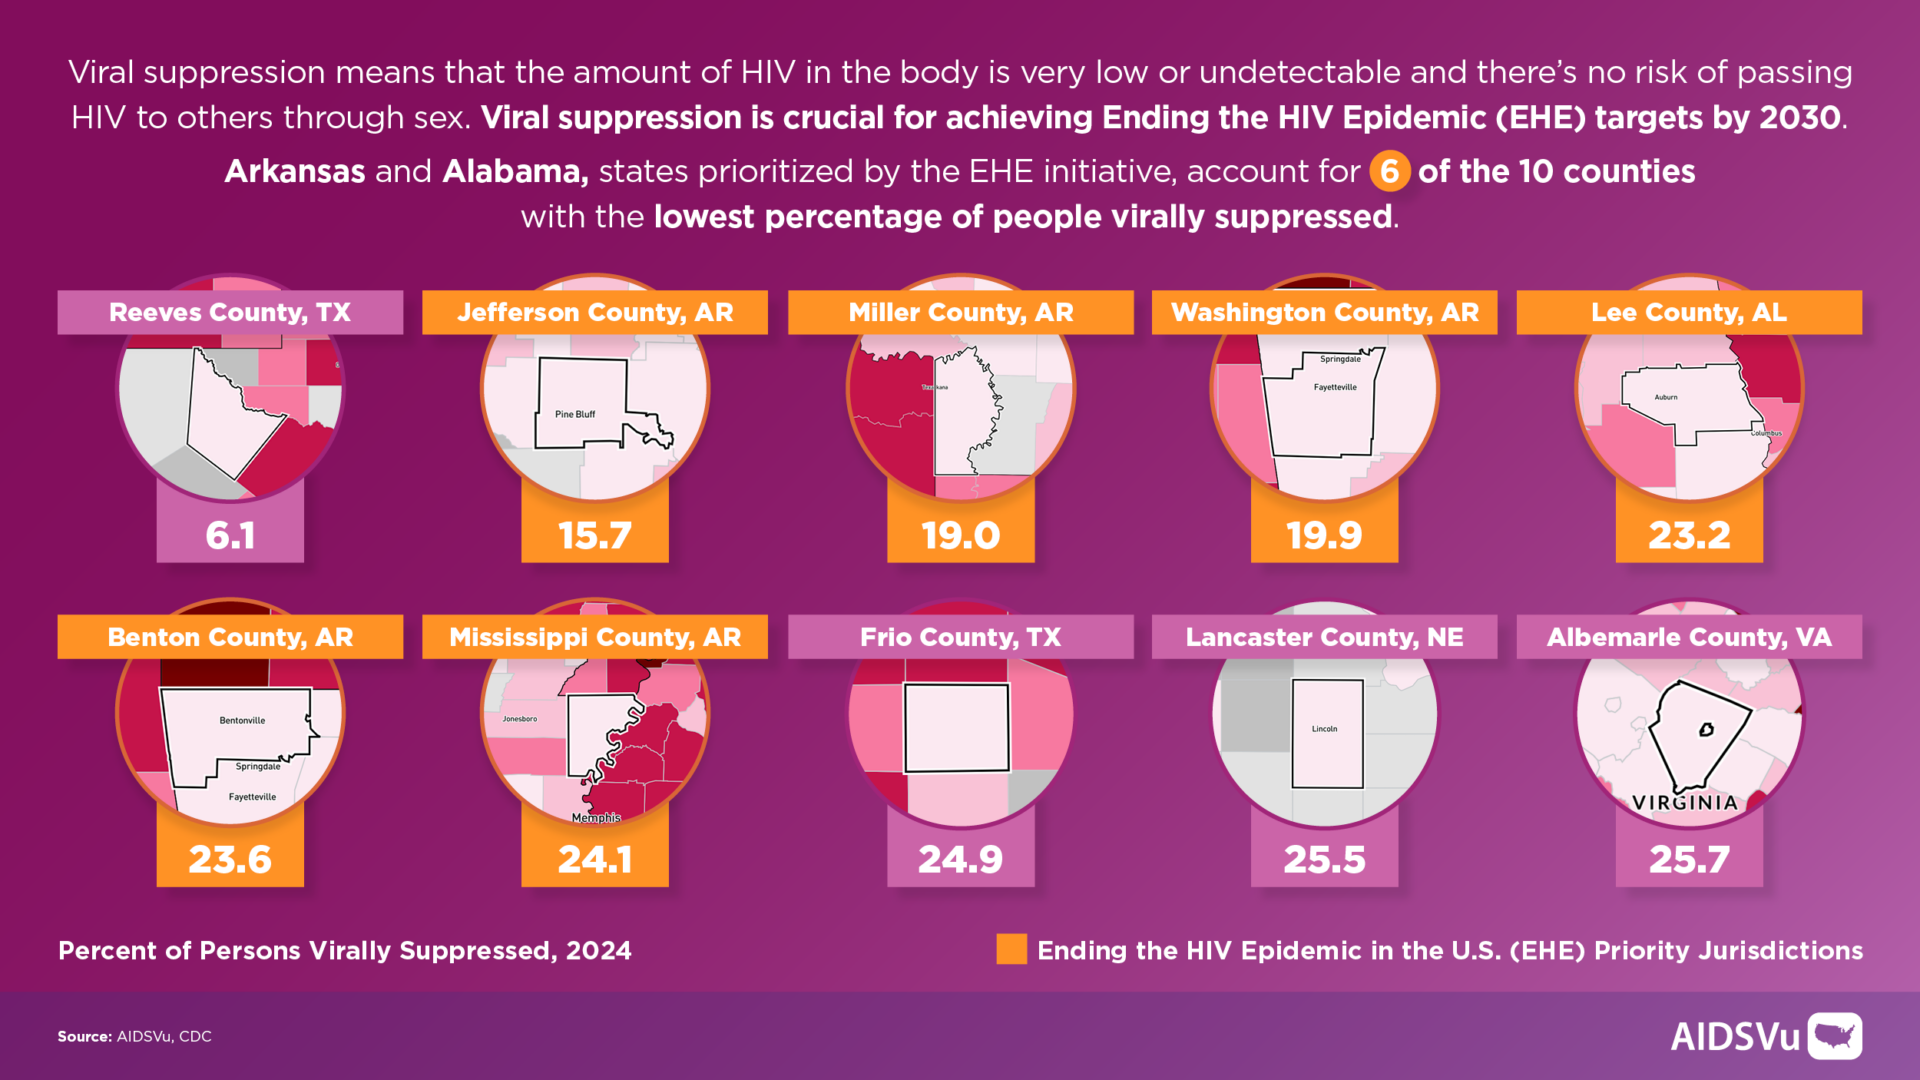
Viral Supression
View partner resources to learn more about the HIV epidemic today:






Share these social media posts and infographics on LinkedIn, X, and Facebook to help spark conversations about the latest HIV insights, equitable access to HIV prevention, and the ongoing effort to end the HIV epidemic.
Post 1 – Long Form (LinkedIn or Facebook)
New HIV diagnoses continue to decline in the United States. In 2024, there were 38,765 new HIV diagnoses — an 18% decline since 2008 and a 1% decrease from 2023.
While this progress is encouraging, continued investment in HIV prevention, testing, and care is essential to sustain progress and reach communities still experiencing a disproportionate burden of HIV.
Explore the latest AIDSVu data, infographics, and resources here: https://aidsvu.org/resources/toolkits/annual-launch-toolkit-2026/
#AIDSVu #HIVData #HIVPrevention #PublicHealth
Post 1 – Short Form (X or Instagram)
New HIV diagnoses are declining across the country, but sustained investment in HIV services is needed to maintain progress. Explore the latest data and resources from @AIDSVu: https://aidsvu.org/resources/toolkits/annual-launch-toolkit-2026/
#AIDSVu #HIVData #HIVPrevention #PublicHealth
Post 2 – Long Form (LinkedIn or Facebook)
#DYK? In 2024, Black individuals represented 39% of those living with #HIV, despite comprising just 12% of the U.S. population.
Differential access to social factors continues to contribute to disparities in health outcomes for people living with or at risk for HIV. Addressing social determinants of health is paramount to achieving health equity and ending the HIV epidemic.
Explore the latest data and resources from #AIDSVu here: https://aidsvu.org/resources/toolkits/annual-launch-toolkit-2026/
#HIVData #HIVPrevention #PublicHealth #HealthEquity
Post 2 – Short Form (X or Instagram)
#DYK? In 2024, Black individuals represented 39% of those living with #HIV, despite comprising just 12% of the U.S. population.
Learn more with the latest @AIDSVu data: https://aidsvu.org/resources/toolkits/annual-launch-toolkit-2026/
#AIDSVu #HIVData #HIVPrevention #PublicHealth #HealthEquity
Post 3 – Long Form (LinkedIn or Facebook)
Out of the 48 Ending the HIV Epidemic counties, 7 of the 10 counties with the highest rate of new diagnoses are in the South.
The South continues to experience the greatest #HIV burden in the United States. Strengthening access to HIV prevention, testing, and care in Southern communities remains critical to ending the HIV epidemic nationwide.
Explore the latest data and resources from #AIDSVu: https://aidsvu.org/resources/toolkits/annual-launch-toolkit-2026/
#HIVData #HIVPrevention #PublicHealth #HealthEquity #EndingTheHIVEpidemic
Post 3 – Short Form (X or Instagram)
Out of the 48 Ending the HIV Epidemic counties, 7 of the 10 counties with the highest rate of new diagnoses are in the South. Local #HIV data can help show where the epidemic remains most concentrated and where resources are needed the most.
Learn more about regional data and disparities with @AIDSVu: https://aidsvu.org/resources/toolkits/annual-launch-toolkit-2026/
#HIVData #HIVPrevention #PublicHealth #HealthEquity #EndingTheHIVEpidemic