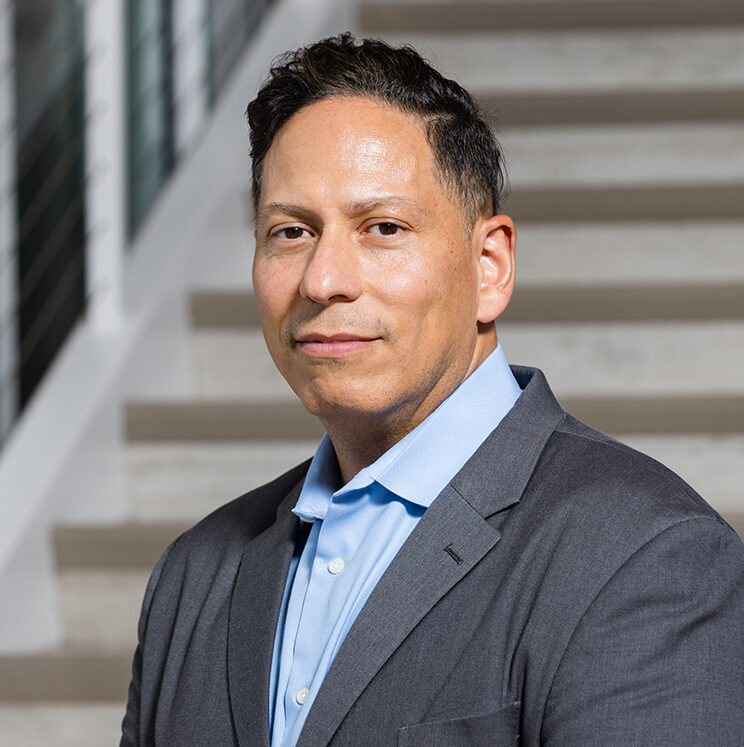
Dr. Amrita Rao and Dr. Stefan Baral are epidemiology researchers at Johns Hopkins University’s Bloomberg School of Public Health. Their recent work includes a Stigma Dashboard that visualizes stigma-related data for the communities most impacted by HIV in order to demonstrate progress to mitigating stigmas across different geographic regions.
Q: What led each of you to epidemiology and to HIV-related research specifically?
Dr. Rao: I’ve always been drawn to the power of data and how data can be used to make an argument for something or to tell a story and epidemiology provides a home to marry the interest between the use of data and a passion for work in a space dedicated to reducing inequitable health outcomes. I first became involved in HIV research in 2015 when I worked as a master’s student on a study led by Dr. Baral, examining vertical HIV transmission among children of sex workers in South Africa. Now, 10 years later, we continue to work together, and my research has really grown and changed in certain ways, but still centers on this idea of understanding and addressing social and structural barriers to HIV service uptake among marginalized populations in the U.S. and internationally.
Dr. Baral: I came into this work after clinical training and with a human rights perspective. I started working at the Center for Public Health and Human Rights and HIV is just one of the conditions that the center covers. Structural determinants, stigma, and beyond are so closely linked to a human rights context that it often is one of the most discussed and studied manifestations of human rights violations. That’s really what brought me into HIV research — the entryway with a focus and interest in both human rights and epidemiology. After an international rotation in Uganda, I began to understand population health outside of individual health. We hadn’t really been taught about this in medical school, which is very focused on individual, clinical health. It became very clear to me early on in my Uganda rotation that so many of the issues and challenges were really at the population level, and those needed to be addressed to help any sort of individual clinical interventions that we were trying to do.
Q: HIV-related stigma can impact an individual’s willingness to seek testing, treatment, and care and can even inhibit a willingness to use PrEP. The new Stigma Dashboard on AIDSVu tracks stigma across multiple qualitative metrics; how do you think tracking these data can help stakeholders better understand this aspect of the HIV epidemic?
Dr. Rao: Visualization of stigma data in this way provides us with an epidemiologic tool to monitor stigma across regions and years. One of our goals is for the Stigma Dashboard to serve as a resource for local organizations, health departments, and advocates to have a common language — instead of measures to describe stigma as part of research and for subsequent advocacy. With some additional planned geographic granularity, the hope is that we’ll be able to use the dashboard to eventually serve as a proxy for potentially identifying stigma hotspots where there are opportunities for additional efforts to be incorporated to mitigate the impacts of stigma on HIV risk. As part of this effort, we’ve been working closely and directly to establish partnerships with health departments to gauge their interest in and assess the utility of the dashboard to make sure that what we’re proposing doing here — both now, and in the future — aligns with interest and future applications of this to existing service delivery.
Dr. Baral: One thing to keep in mind is that stigma manifests in different ways and against different attributes. Racism is stigma; homonegativity is stigma; transphobia is stigma; and the list goes on. Of course, HIV stigma is also a form of stigma. It can often be stigma affecting other elements like homonegativity that can act as the barrier to engagement in care among communities that are at high risk for HIV acquisition, given individual network and structural determinants. What you end up having is negative forces affecting people’s engagement in care, treatment, and PrEP — even outside of PrEP specific stigmas. What we’ve seen, in many ways, is that the government understands this. The U.S. government has prioritized responding to stigma as a central aspect of the National HIV Strategic Plan as part of the Office of National AIDS Policy. But historically that’s been almost all qualitative. We need to end stigma. But one of the things we are doing is providing a quantitative description of stigma and witnessing its variation across different geographies across the U.S. between urban versus rural, southern versus northern, and between coastal and central states. There’s a tremendous amount of variability and providing some numbers allows people to put in real targets. Saying ‘zero stigma’ is an aspirational goal, but what if we reduce stigma by 10% or 15% over the next three to five years? That way we can actually set some targets around it, because we are measuring it and we have a dashboard that allows us to track progress towards it.
Q: Your team chose to use qualitative survey data to visualize and track this issue. Why is it important that we include these kinds of data in our research?
Dr. Rao: There’s an important distinction between what this survey data is and some of our other qualitative data collection efforts. The survey data — because it represents data collection on thousands of men who have sex with men (MSM) that are participating in the American Men’s Internet Survey (AMIS) — is truly what we’re presenting on the dashboard right now. It’s a hard quantitative number representing a percentage of folks that are endorsing specific attributes of stigma. What we’re also doing as part of this project is using qualitative research methods in the form of needs assessments and focus group discussions to inform the development of the dashboard itself. We’ve used input from health departments on what we’re visualizing, as well as from community-based organizations (CBOs) on what’s important to show in terms of relationships when we think about model outputs. That distinction is critical to make between the quantitative and qualitative pieces. But I do think that collecting the annual survey data allows us to actually monitor trends in sexual health and in stigma. These data are often not measured in these types of ways. So, it’s difficult to know what the current problem is and what progress has been made to address that problem without having some benchmark to measure progress against.
Dr. Baral: Historically when these issues have been discussed, they’ve been discussed qualitatively, as ‘Stigma is bad. We need to do something about stigma.’ And we agree, but it takes the pressure off folks to say, ‘We are responding to stigma, we are looking to end stigma.’ With these surveys and other ways of quantifying, we are saying: ‘Yes, we all want to end stigma, but here’s the current state of stigma.’ We present something that may be achievable when we measure this again in a year or two. We all want to see it trending down – so actors are going to be held accountable to ensure that their initiatives are working and effective. It’s not enough for it to be just rhetoric and messaging; we can’t just communicate about PrEP and do nothing else. We must provide medicines, and procurement, and ensure people are using it, and create safe pathways for people to access it. The stigma intervention should be held to the same account. We want to ensure that initiatives are working – we want to measure that. If they aren’t working, we want to fix them. If they are working, we want to scale them up and bring them to other places where they’re not using them.
Q: There has been an increasing focus on health equity in recent years, especially around public health issues such as HIV, viral hepatitis, and the opioid epidemic. How does a focus on HIV-related stigma and other social determinants of health help stakeholders work towards increasing health equity?
Dr. Rao: At this point, with where we are in terms of the HIV epidemic in the United States, stigma has been recognized and clearly labeled as a critical determinant of poor mental and sexual health among communities at risk of or living with HIV — including a big driver in health inequities experienced by folks. Yet, most existing HIV-related interventions continue to focus on individual risk behaviors rather than thinking about these larger social and structural issues. Often, the reason that folks give for the disconnect between recognizing stigma as a social determinant of health and actually translating it into interventions is the limited capacity for researchers and providers to actually measure stigma and complex stigma processes. From there, there needs to be capacity to develop methodologically sound interventions that are guided by both theory and lived experience. Truly, the goal of the visualization of stigma data creates a common set of measures by which we can talk about stigma and advocate for stigma mitigation. That is central to the end goal of reducing health inequities.
Dr. Baral: In many ways, stigma and structural determinants are what separate equity and equality. Often, people will say ‘Well, really what you want is health equality.’ But what we actually want is health equity, meaning we may need to do more for people who need more. We may need to invest a greater number of resources on a per person basis to overcome these structural determinants that have worsened outcomes within their community. We are trying to contribute to this case here by measuring stigma in a very nuanced way – through anticipated stigma, perceptions of stigma, enacted stigma, intersectional stigmas and beyond. We want to understand the drivers that worsen health outcomes among certain communities structurally, and then provide insights into how to respond to them.
Stigma is a central underpinning as to why somebody is at risk for being homeless, and why a gay man may be at risk for HIV, and beyond. It’s like you can follow this pathway along why some folks have worse addictions, why some folks have more dependencies, and so on – it’s that stigmas have manifested in different ways. All these roads lead back to stigma in one way, shape, or form. The more we can specify, measure, and understand it, the better we can get at addressing the underlying drivers of inequities and thus trying to work towards increasing equity. We are trying to understand why some folks are doing worse on these health outcomes than other folks, well a lot of that is really related to these human rights violations, as I spoke about earlier. We’re not allowing people to achieve the rights that they deserve. The language we use for it now is ‘stigma,’ but it really means the same thing. And the manifestations of it are inequities in health outcomes, which is the sort of thing that we can measure – if certain folks have worse blood pressure outcomes, worse blood sugar outcomes, worse PrEP outcomes, worse HIV outcomes. People are often now using the language of equity, but they use it loosely. They say, ‘We are taking an equity approach to this’ – but what do you mean by that? The reason we want to measure these things, and create dashboards, and publicize them is to try to quantify all this as much as possible. That way we can provide insights into commitments to equity-driven programs or equity-founded programs in communities. We can say, ‘These are the determinants that are driving the inequalities that you’re ultimately seeing and need to be addressed so that you can do better by folks that have been historically marginalized.’
Q: What is your vision for how these data will be used and how this dataset will grow in the future?
Dr. Rao: We’ve divided our dashboard development process into two phases. Phase one includes the creation of the page within AIDSVu to help us visualize existing data and show geographic variation in the endorsement of stigma items. For now, we’re just beginning with the three geographic areas using AMIS data, but we have plans to include additional jurisdictions and data collection cycles, including the 2019 through 2021 annual cycles. In phase two, the next big step is to involve the visualization of model outputs from a systems dynamics model that’s led by our collaborators, Feinian Chen and TA Guo at Johns Hopkins. The model outputs will be for specific geographic priority areas, and will, hopefully, allow the user to toggle data inputs and available resources to see changes in outcomes based on stigma mitigation. Based on what the models show us and the process for developing the systems dynamics model, the second phase will include various steps, including qualitative data collection. We’ve been working with health departments and CBOs to understand the different causal relationships and create a conceptual model that can then inform the eventual systems dynamics model that can then show the impact of stigma mitigation. The idea is that health departments and those with experience delivering services are able to inform the diagrams and patterns that are being visualized on the stigma dashboard through these systems dynamics models. It’s been a really unique opportunity to bring together health department folks, modelers and epidemiologists together to think through these relationships and modeling it out for phase two.
Dr. Baral: Currently, there are two different models being developed – the other is with Sam Jenness of Emory’s Rollins School of Public Health. There’s certainly an element around how these data are going to be used as well as the different stakeholders that we want to be using them. Part of what we wrote into this grant was a series of questions to ask health departments – showing them the dashboards and then asking ‘Is this what you need? Is this what you want? Is there a way to do this better? Is there a way to deliver this better? Is there a way to organize this better?’ We want to ensure that folks really use this to inform their programs. The promise of this grant was that not only would we collect more stigma data, collate it, and organize it, but also that we would think about the optimal ways of visualizing it and ensuring that it gets used. We’re really committed to the element of visualization and use with AIDSVu, but also going back to health departments with user testing, showing them and working through different elements of the dashboard and understanding if we can optimize or improve upon it. With AIDSVu, there is room for this to grow. There is really room to improve how stigma are demonstrated and visualized. There’s a tremendous amount of opportunity and we’re just starting. Stigma is so complex and so central to multiple problems that affect our society. Stigma is so complex and it’s so central to so many of the problems that affect our society. It’s complex, so people think it’s too messy. But we need to spend the time to dig through that messiness, to break it down so that people can really react and respond to it better.


