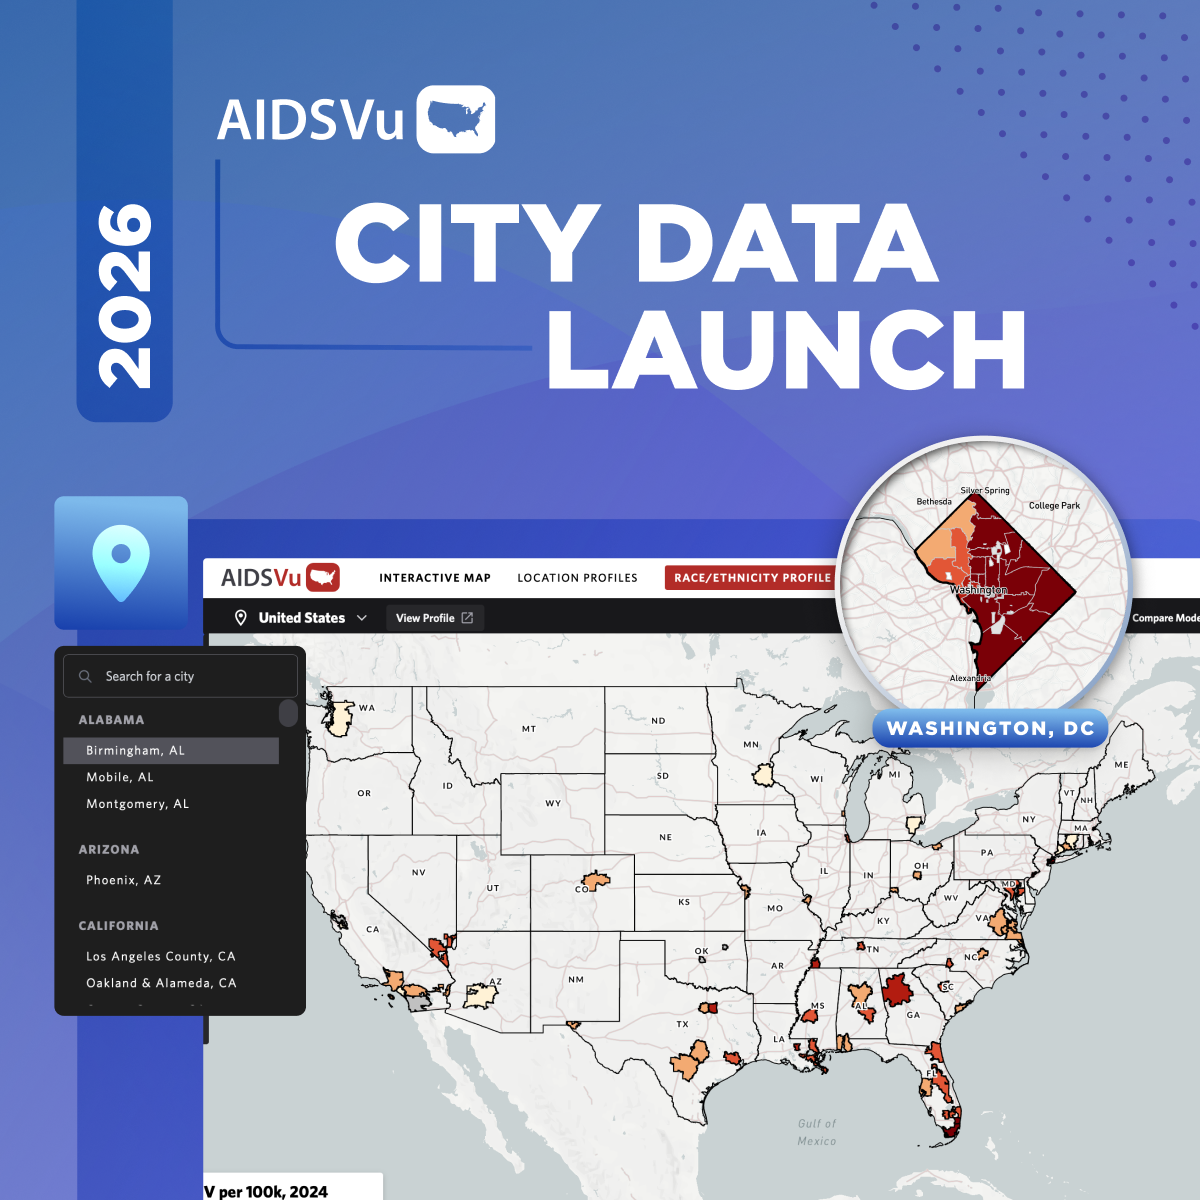
New 2024 data show that cities represented on AIDSVu account for more than half of all new HIV diagnoses nationwide, underscoring the importance of local data in addressing the HIV epidemic.
ATLANTA, GA (October 29, 2026) — AIDSVu, the nation’s leading interactive resource for visualizing the HIV epidemic, today added San Jose, California, to its city-level maps, presenting ZIP Code-level data for 61 cities and jurisdictions. Together, these cities accounted for 54% of all new HIV diagnoses in the U.S. and Puerto Rico in 2024, giving public health officials, policymakers, and community organizations a clearer view of where HIV needs are greatest.
The launch includes detailed data on HIV prevalence, new diagnoses, demographics, and HIV care outcomes, offering public health officials, policymakers, researchers, and community organizations critical insights to inform HIV prevention and care efforts. See below for a list of the 61 cities with data available on AIDSVu.
“By expanding our city-level data to include San Jose and updating our existing city profiles, AIDSVu is providing communities with the information they need to identify emerging trends and better understand their local epidemics,” said Dr. Patrick Sullivan, Principal Scientist of AIDSVu and Professor of Epidemiology at Emory University’s Rollins School of Public Health.
Why City-Level Data Matters
AIDSVu works directly with city and state health departments to expand access to detailed HIV data and provide a more complete picture of the epidemic across the United States. The city-level expansion helps public health officials, researchers, policymakers, and community organizations better understand HIV trends and disparities where the need is the greatest. Some facts about the cities with data available on AIDSVu include:
- These 61 cities represent every major U.S. region — South, Northeast, Midwest, and West — plus Puerto Rico, making it nearly a full map of America’s most significant population centers.
- Detailed ZIP Code-level HIV data is available for 24 of the 25 most populous U.S. cities, accounting for 54% of all new HIV diagnoses nationwide.
- These cities cover all 25 Metropolitan Statistical Areas (MSAs) with the highest number of new HIV diagnoses in 2024.
- Together, these 61 cities account for over 70% of U.S. GDP.
- New York City, Los Angeles, San Francisco, Washington DC, Atlanta, Chicago, and Miami are consistently ranked among the top 10 U.S. metros for LGBTQ population density and visibility.
- Most of these cities host Ryan White Part A–funded programs, meaning they receive federal grants for HIV care coordination, medication access, and community support.
- 17 of the 20 Centers for AIDS Research (CFAR) are in cities mapped on AIDSVu.
- Washington, DC, state capitals like Boston, Austin, Raleigh, Nashville, and Denver, and large regional centers like Phoenix and Atlanta all represented on AIDSVu are key for both political organizing and policy advocacy. Together, these metros represent the majority of the U.S. congressional delegation’s home districts, making them critical for coalition outreach or national advocacy efforts.
“These data illustrate why understanding the HIV epidemic requires looking beyond national trends to the communities where people live,” said Dr. Sullivan. “With detailed local data, we can better identify where progress is being made, where disparities persist, and how public health resources can be directed to communities with the greatest needs.”
Five Cities Show Persistent Disparities
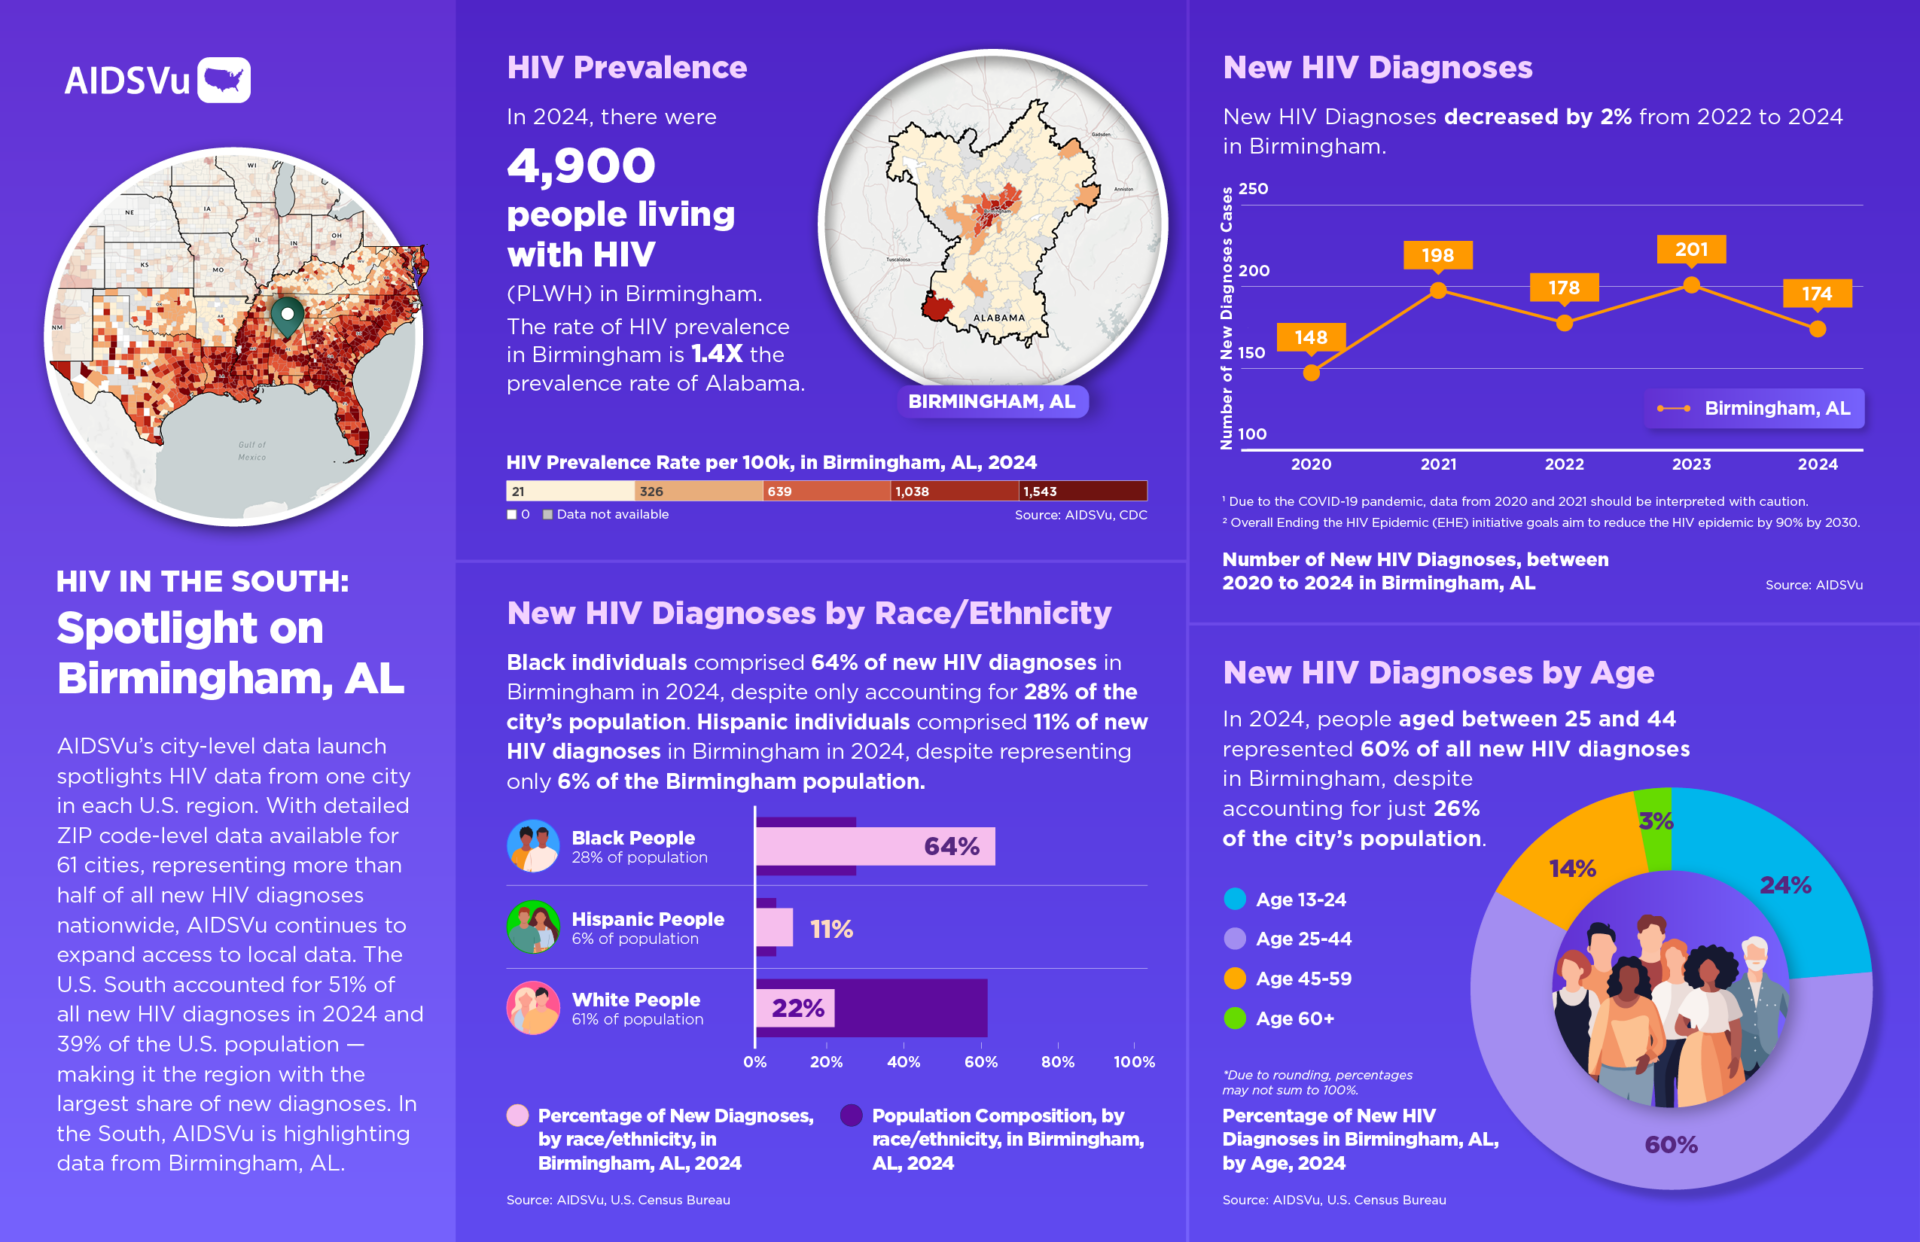
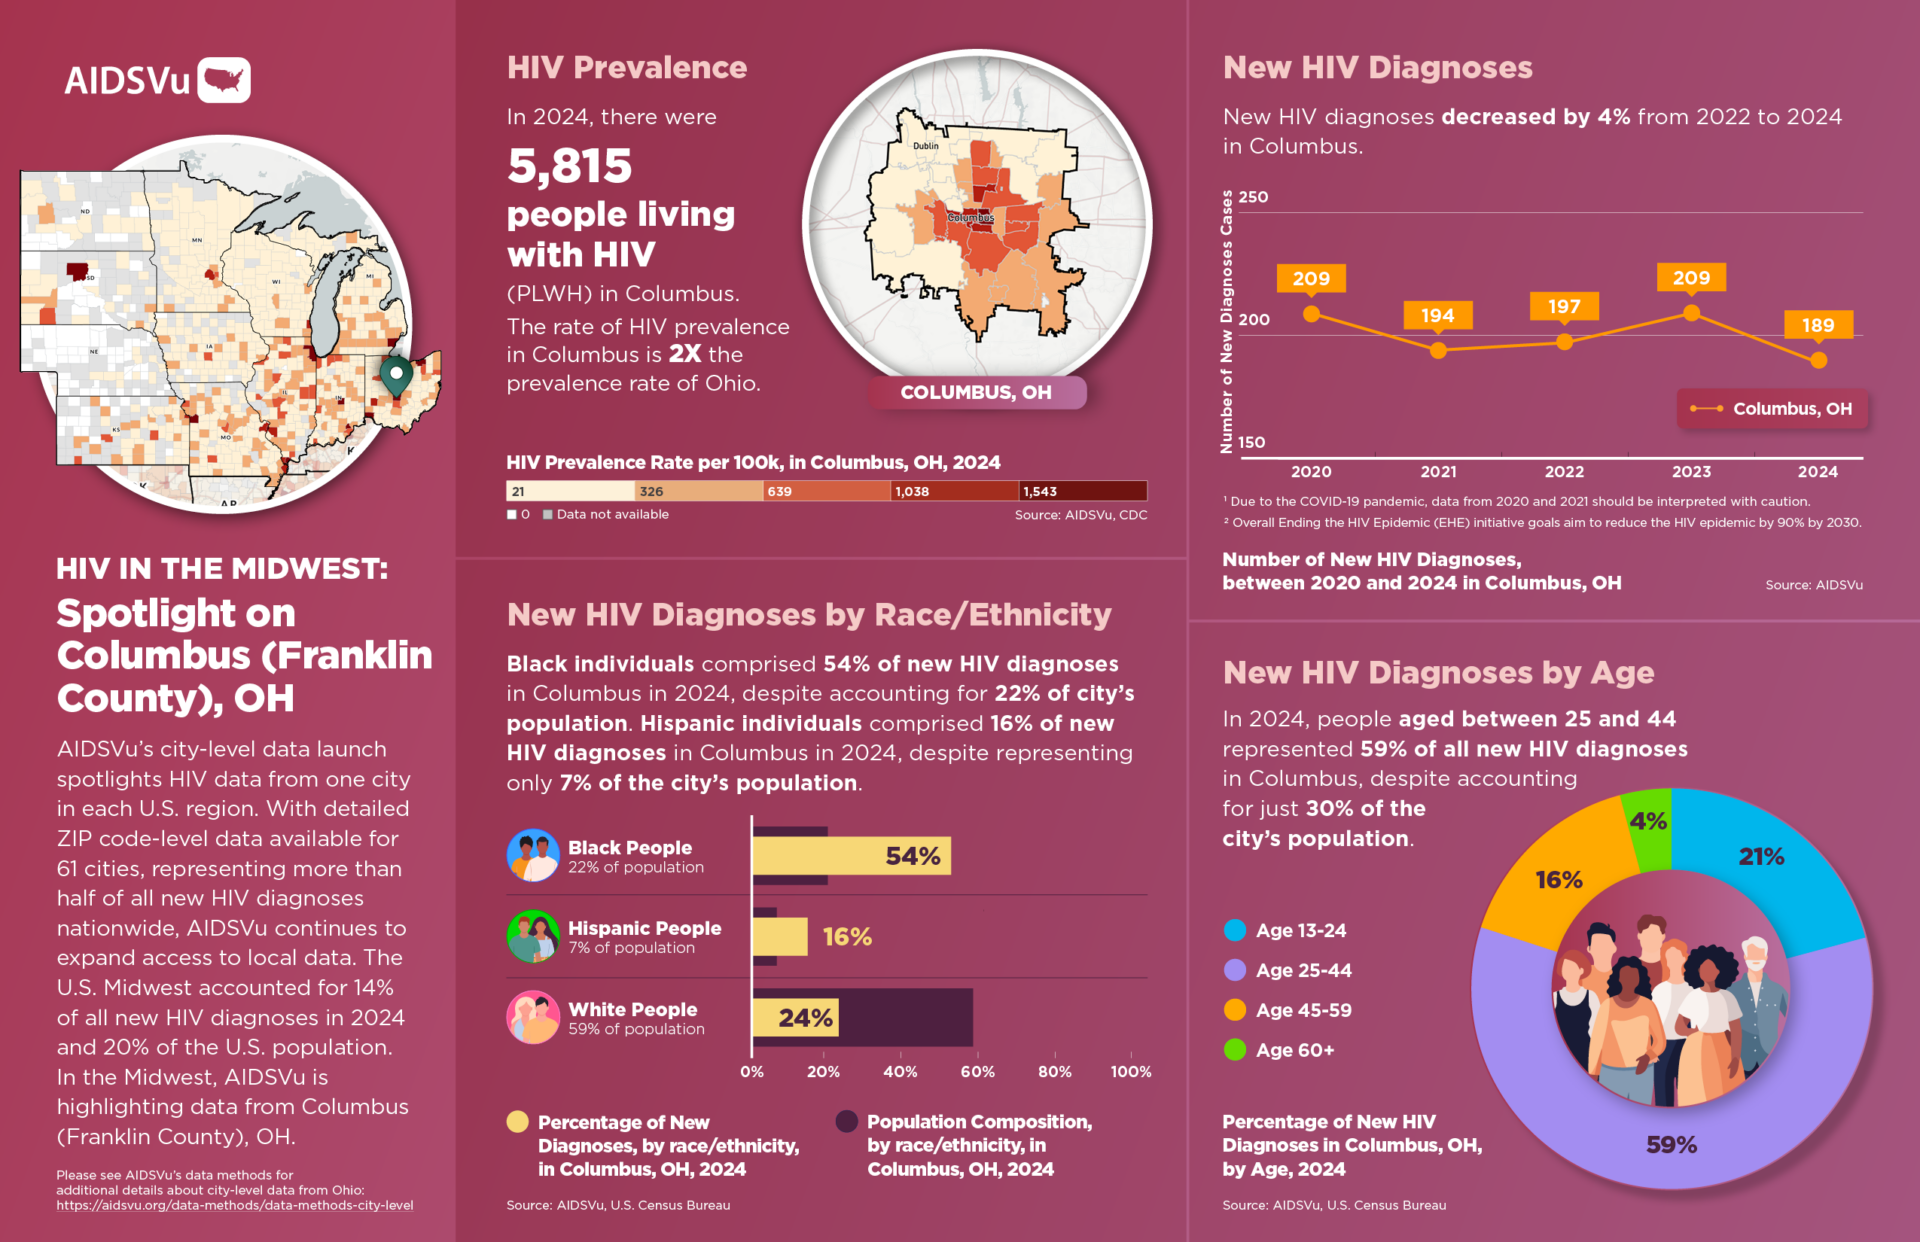
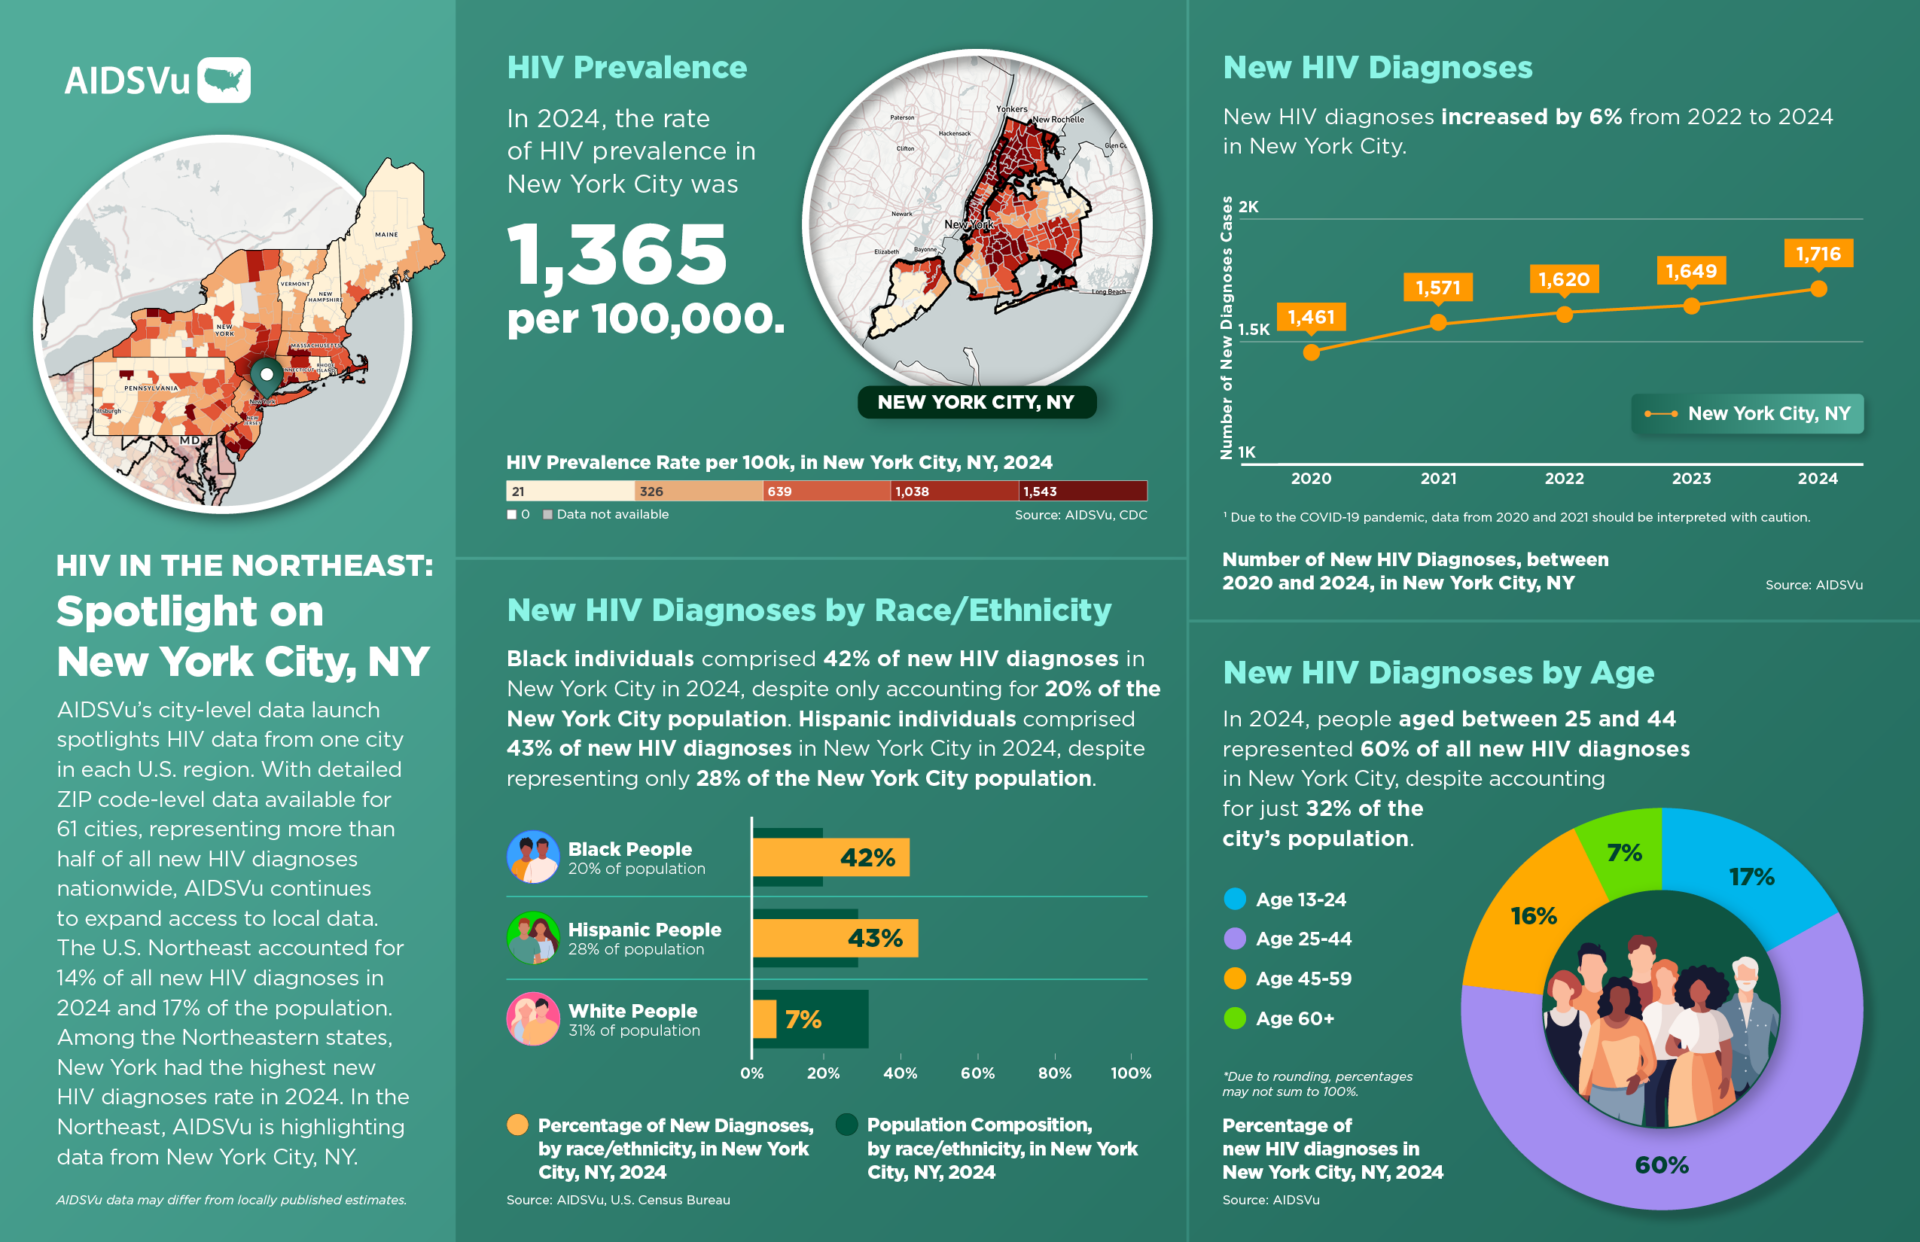
As part of this year’s data launch, AIDSVu developed data insights and infographics for five cities to reflect a variety of regions and trends: San Jose, CA; Columbus, OH; New York City, NY; Birmingham, AL; and Washington, D.C. Together, the city-level insights reveal important differences in HIV trends across communities, illustrating how geography, race, and access to care continue to shape health outcomes.
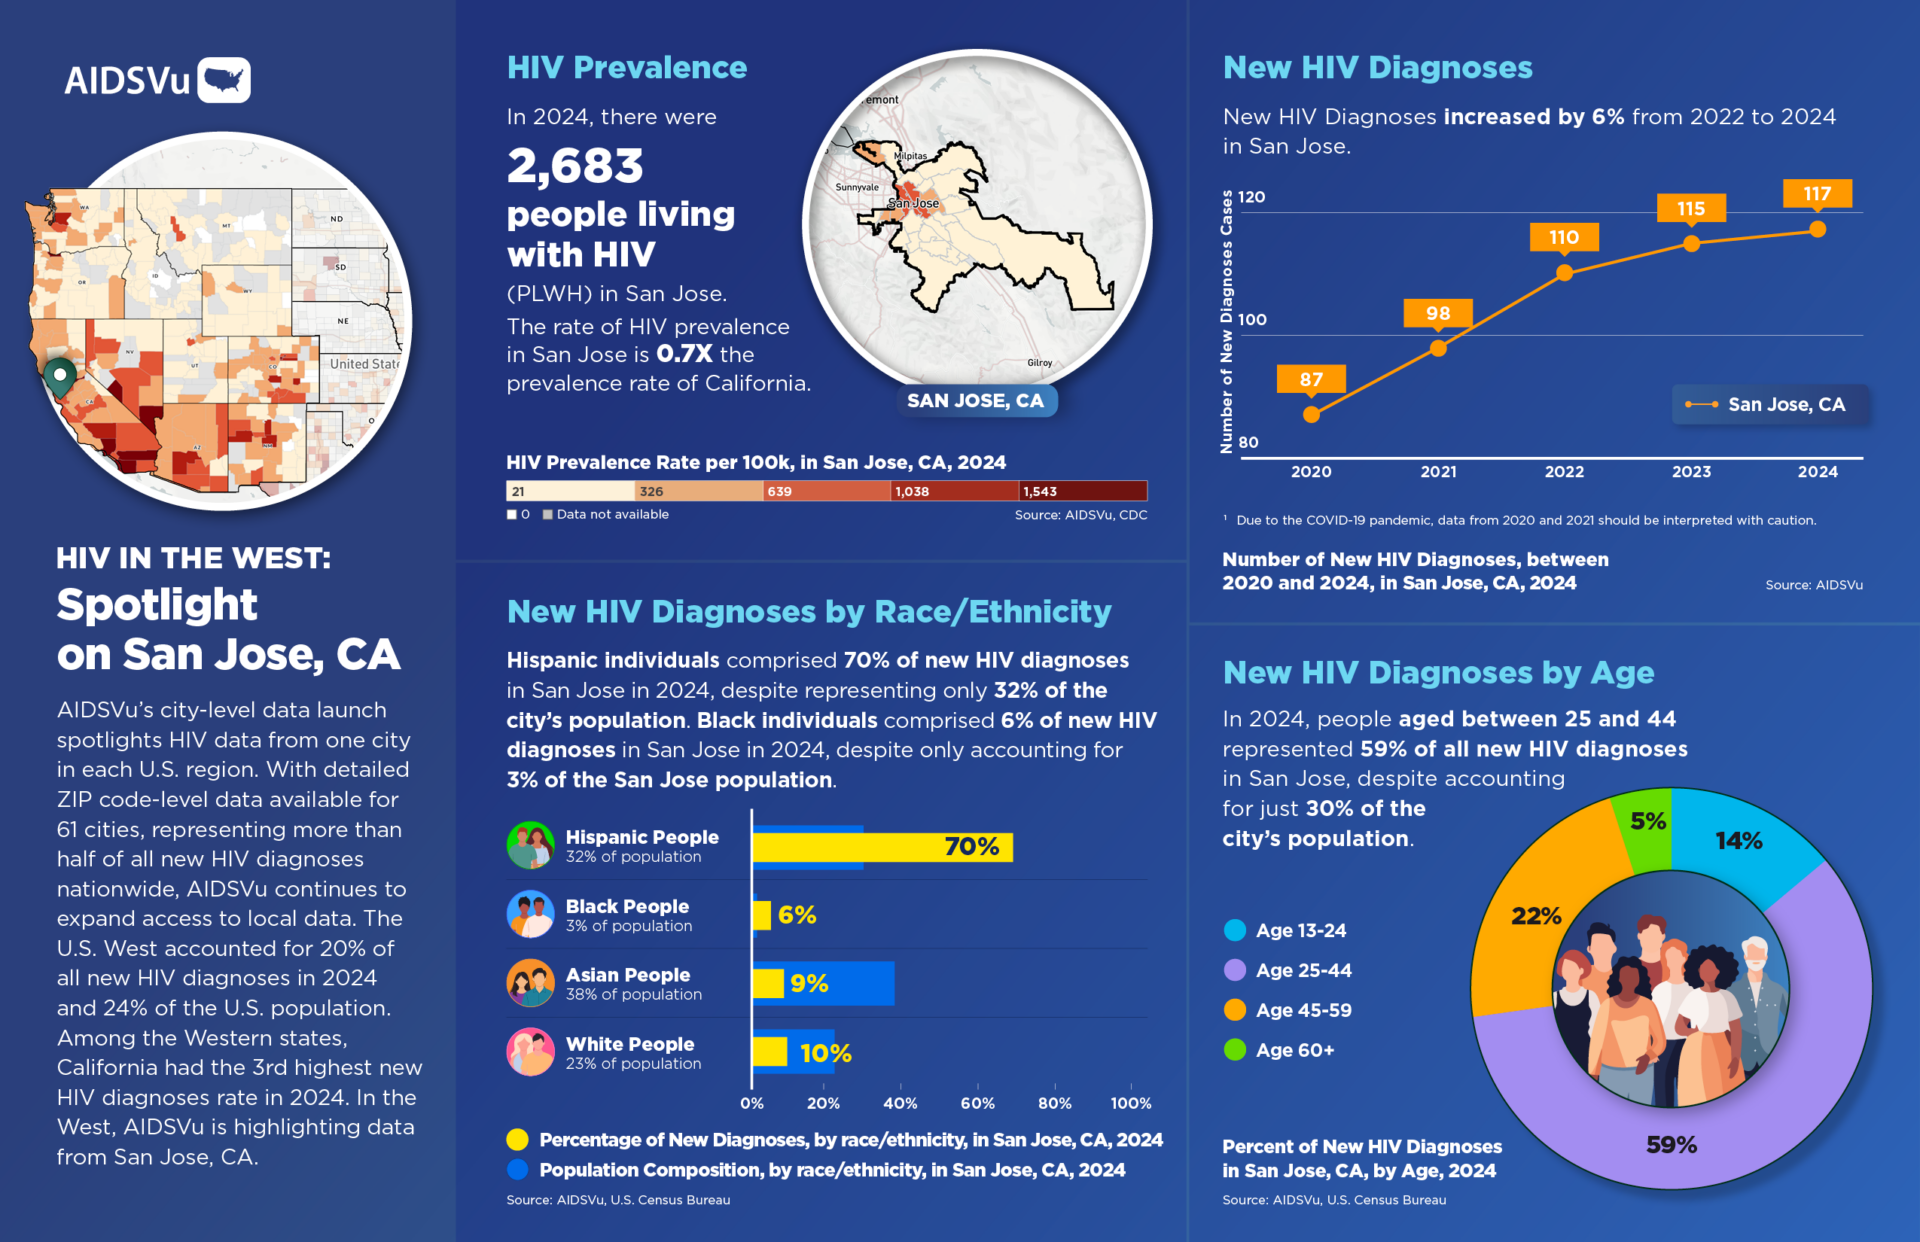
- San Jose, CA: Newly added to AIDSVu, the rate of HIV prevalence in San Jose was 30% lower than the prevalence rate of California in 2024. Yet, San Jose reported a 6% increase in new HIV diagnoses between 2022 and 2024. Hispanic individuals comprised 70% of new HIV diagnoses in San Jose in 2024, despite representing only 32% of the city’s population.
- Columbus, OH: New HIV diagnoses decreased by 4% from 2022 to 2024 in Columbus; however, Black individuals accounted for 54% of new diagnoses in 2024, despite representing just 22% of the city’s population.
- New York City, NY: In 2024, New York City reported a 6% increase in new diagnoses from 2022. Black and Hispanic/Latinx individuals accounted for nearly 85% of new diagnoses, despite representing less than half of the city’s population, highlighting the continued disproportionate impact of HIV on communities of color, even in cities with longstanding HIV prevention and care programs.
- Birmingham, AL: Black individuals accounted for 64% of new diagnoses in 2024, despite representing just 28% of the city’s population. In 2024, persons aged 25 to 44 also accounted for 60% of new diagnoses, despite representing only 26% of residents, highlighting the intersection of racial and age-related disparities in the HIV epidemic in the South.
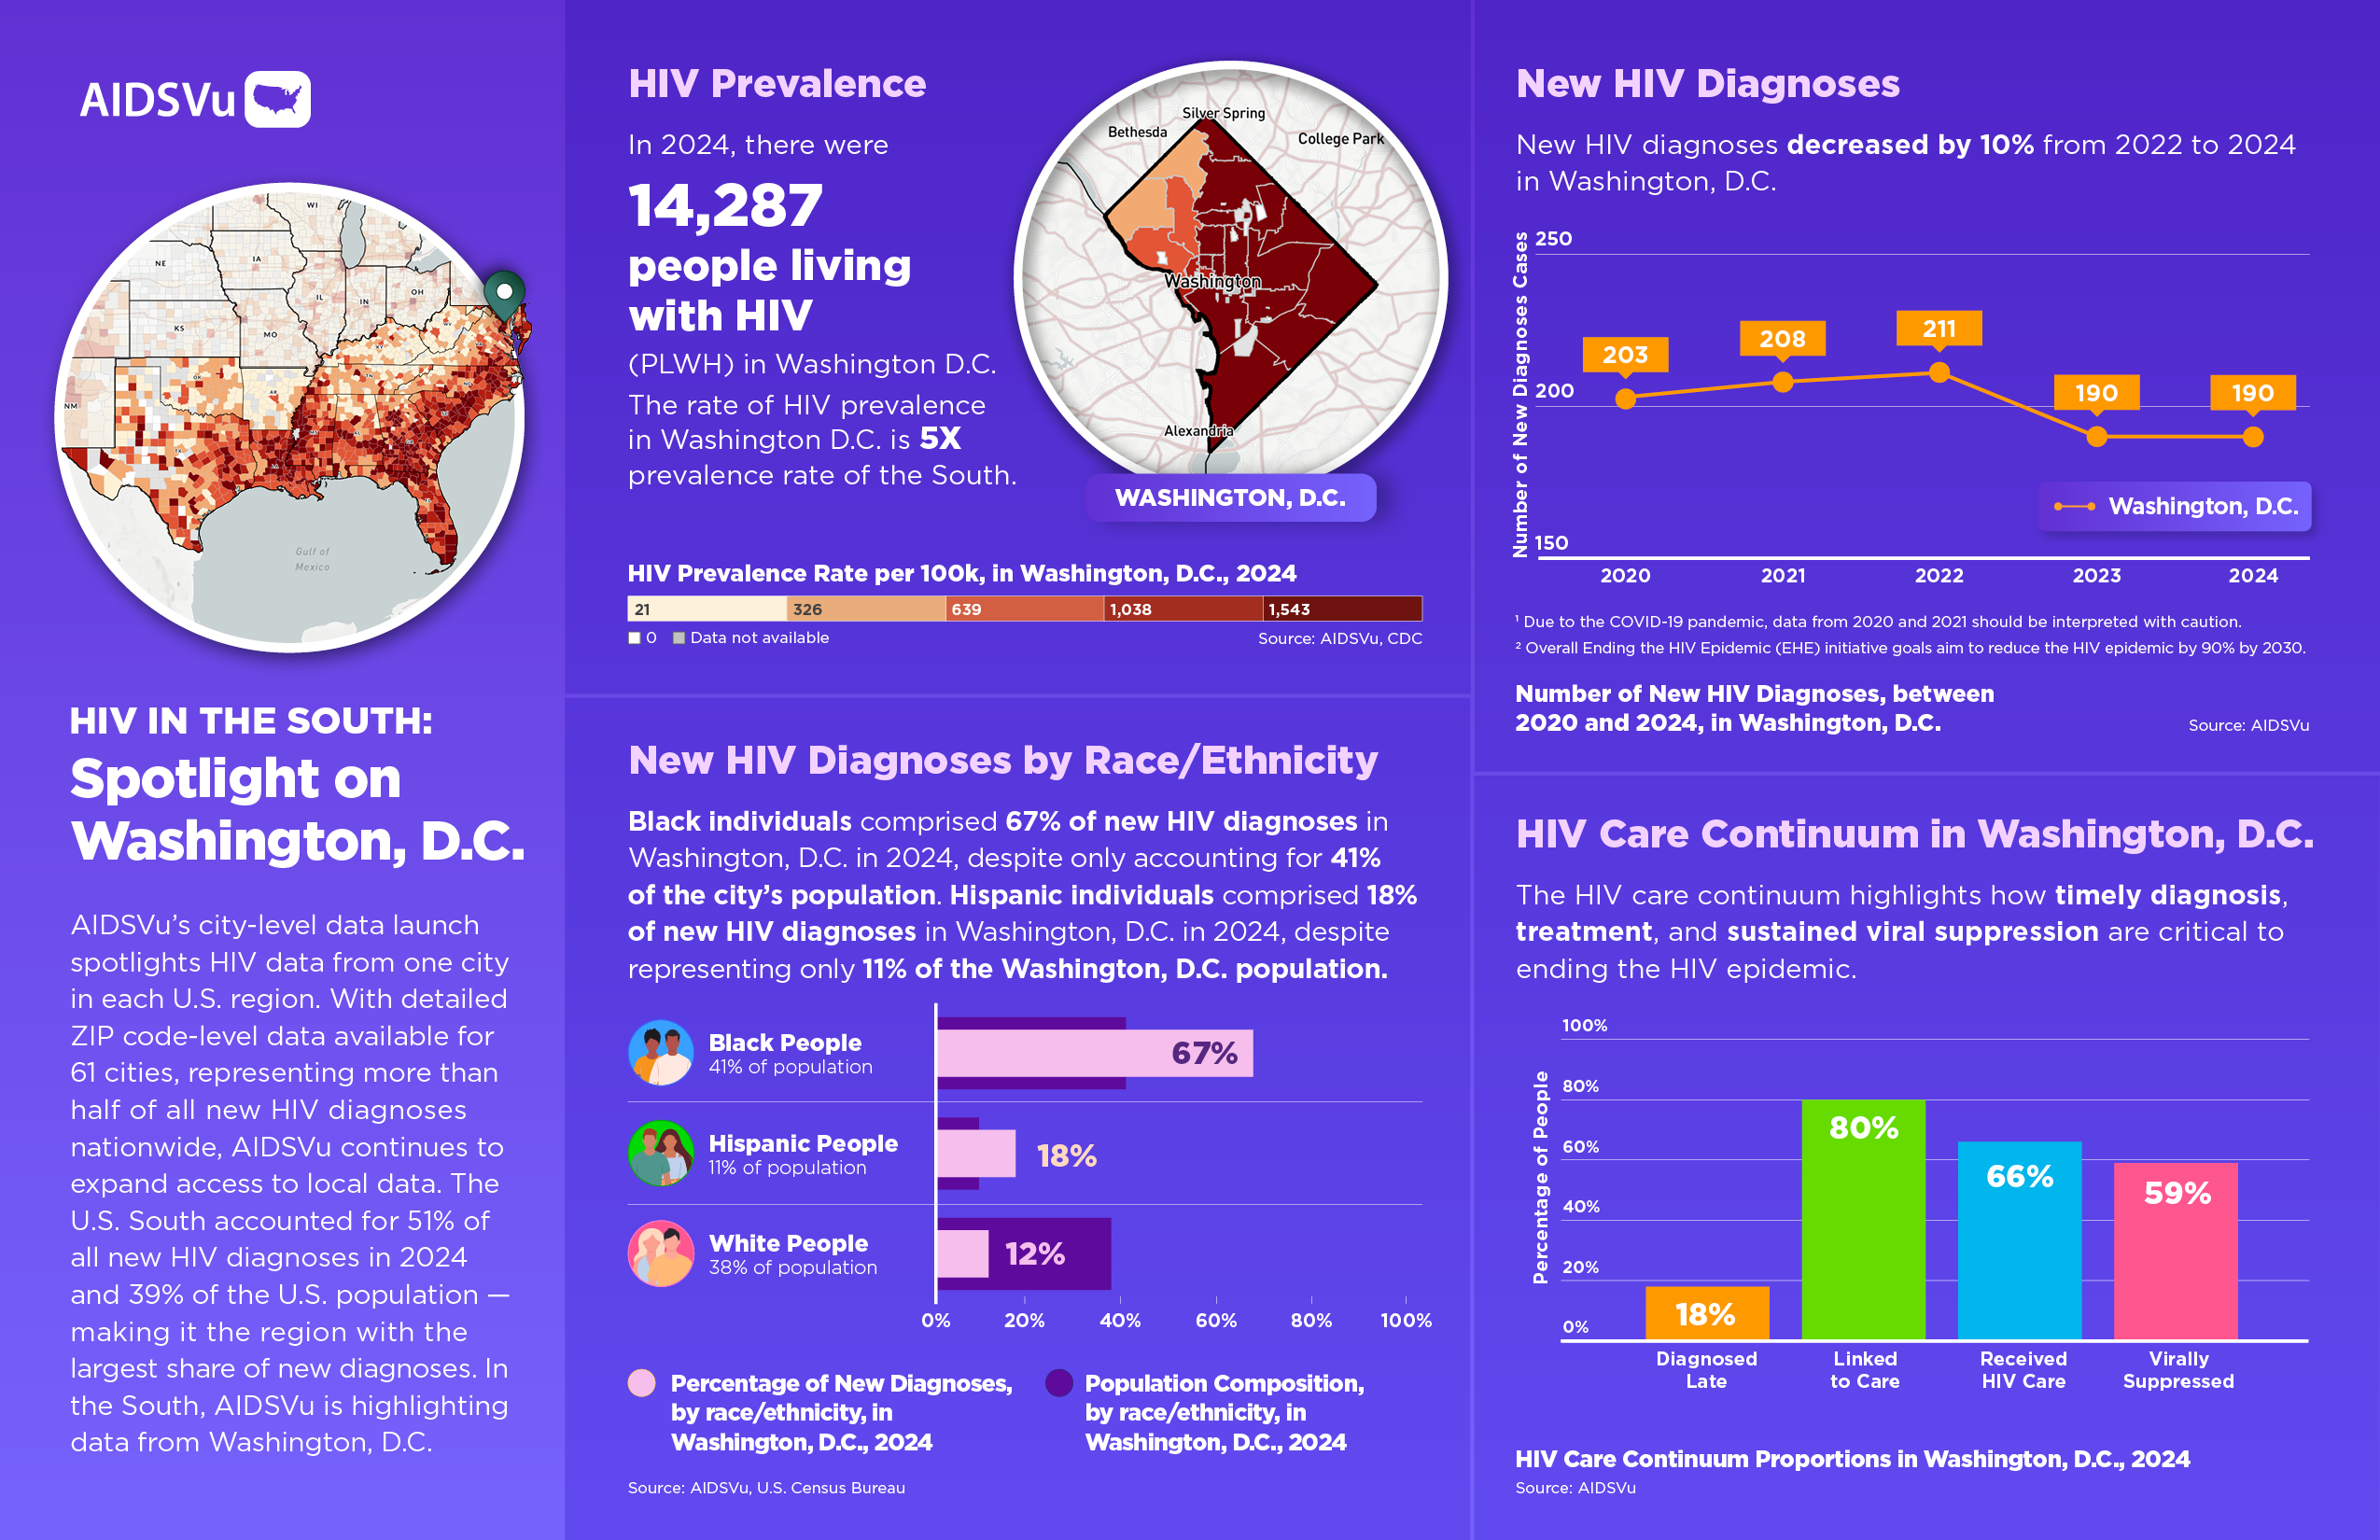
- Washington, D.C.: In 2024, the rate of HIV prevalence in Washington, D.C. was 5 times the prevalence rate of the South. Black individuals also accounted for 67% of new diagnoses despite representing 41% of the population. These findings reinforce the need to address persistent racial disparities alongside overall progress in reducing new HIV diagnoses.
What’s New and Updated:
- Updated ZIP Code-level maps showing HIV prevalence in 2024 and new HIV diagnoses from 2020–2024 across 61 U.S. cities, including San Jose.
- ZIP Code-level maps showing HIV care continuum indicators, including linkage to care, late HIV diagnoses, receipt of care, and viral suppression, where data are available.
- Updated city-level location profiles featuring HIV prevalence, new diagnoses, demographic disparities, and local trends, available as downloadable city-specific fact sheets.
- ZIP Code-level maps highlighting social determinants of health, including poverty, education, median household income, income inequality, and housing cost burden.
- Interactive service locators to help individuals find HIV testing, PrEP, HIV care, stigma reduction, overdose prevention/reversal, harm reduction, and trauma-informed care services.
Cities Available on AIDSVu:
Birmingham, AL, Mobile, AL, Montgomery, AL, Phoenix, AZ, Los Angeles County, CA, Orange County, CA, Oakland/Alameda County, CA, Riverside County, CA, San Diego, CA, San Francisco, CA, San Jose, CA, Denver, CO, Bridgeport, CT, Hartford, CT, New Haven, CT, Washington, D.C., Fort Lauderdale, FL, Jacksonville, FL, Miami, FL, Orlando, FL, Tampa, FL, West Palm Beach, FL, Atlanta, GA, Chicago, IL, Baton Rouge, LA, New Orleans, LA, Baltimore, MD, Boston, MA, Detroit, MI, Minneapolis, MN, Jackson, MS, Kansas City, MO, St. Louis, MO, Las Vegas, NV, Jersey City, NJ, Newark, NJ, New York City, NY, Charlotte, NC, Raleigh, NC, Cincinnati, OH, Cleveland, OH, Columbus, OH, Oklahoma City, OK, Tulsa, OK, Philadelphia, PA, San Juan, PR, Providence, RI, Charleston, SC, Columbia, SC, Memphis, TN, Nashville, TN, Austin, TX, Dallas, TX, El Paso, TX, Fort Worth, TX, Houston, TX, San Antonio, TX, Hampton Roads, VA, Richmond, VA, Seattle, WA, Milwaukee, WI.
About AIDSVu’s Annual City Data Update:
AIDSVu is presented by Emory University’s Rollins School of Public Health in partnership with Gilead Sciences, Inc. and the Center for AIDS Research at Emory University (CFAR). AIDSVu continues to advance its mission to make HIV data widely available, easily accessible, and locally relevant to inform public health decision-making. The site aims to provide researchers, policymakers, and community members with a more comprehensive understanding of the HIV epidemic at the local-, state-, and national-level.
ZIP Code-level data were provided by state and city health departments and compiled by researchers at the Rollins School of Public Health. Learn more about AIDSVu’s HIV care continuum data and sources, see our FAQ and Data Methods.